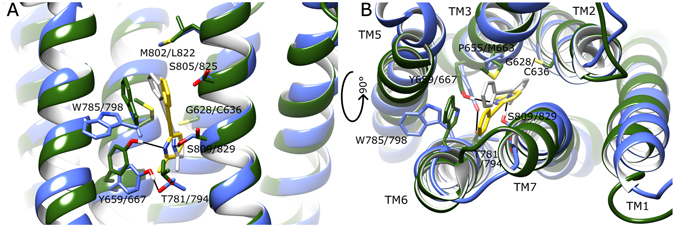
Figure 6.

A comparison of average conformations of mGlu4 with bound MPEP (green, yellow, respectively) and mGlu5 with bound MPEP (blue, grey, respectively) from 2.5–5 µs of respective MD simulations from following perspectives: (A) side-view within membrane and (B) extracellular top-view. Selected residues delineating allosteric pockets or participating in ligand binding are labelled (mGlu5 first, mGlu4 second). Protein-ligand H-bonds are represented by black lines.
