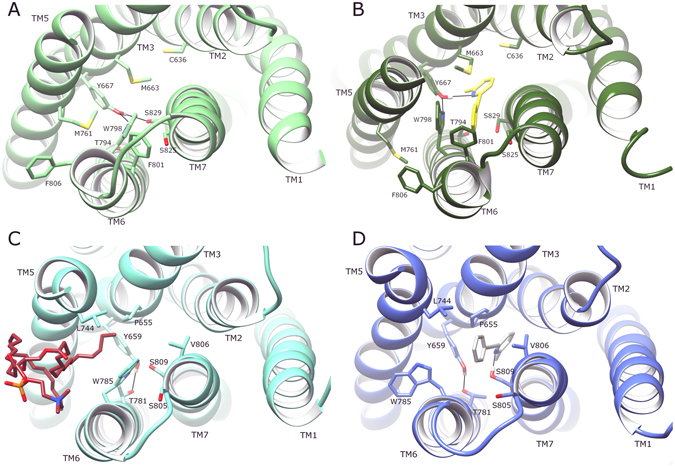
Figure 8.

Comparison of average conformations of (A) apo mGlu4 without MPEP (light green), (B) mGlu4 with bound MPEP (dark green, yellow, respectively), (C) apo mGlu5 without MPEP (cyan) with bound lipid molecule (brown), (D) mGlu5 with bound MPEP (blue, light grey, respectively), each obtained from 2.5–5 µs of respective MD simulations. Receptors are viewed extracellular-side from top. Relevant structural features are labelled, i.e. transmembrane helices (TMs) and residues in the allosteric pocket interacting with lipid/MPEP.
