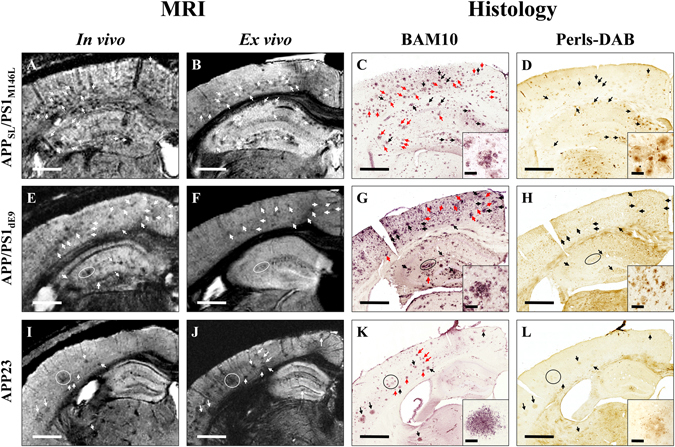
Figure 1.

Comparison between detection of amyloid plaques by Gd-stained MRI and immunohistochemistry in APPSL/PS1M146L, APP/PS1dE9, and APP23 mice. Gd-stained in vivo (column 1) or ex vivo (column 2) MR images were registered with β-amyloid (BAM10, column 3) and iron-stained (Perls-DAB, column 4) histological sections in APPSL/PS1M146L (A–D), APP/PS1dE9 (E–H) and APP23 (I–L) mice. Inserts in columns 3 and 4 display typical plaques for each strain. Hypointense spots (white arrows and circles) are visible in the in vivo and/or ex vivo MR images of APPSL/PS1M146L (A,B), APP/PS1dE9 (E,F) and APP23 (I,J) mice. They can be registered with amyloid plaques (black and red arrows and circles) on BAM10-stained sections (C,G,K). Iron staining reveals iron deposits that can be registered with hypointense spots and amyloid plaques in APPSL/PS1M146L (D), APP/PS1dE9 (H) and APP23 (L) mice. Some amyloid plaques containing iron (black arrows and circles) are visible on MR images. Some others are iron-free (red arrows) and are also detected by MRI indicating that iron is not necessary for MR detection. Scale bars: 500 µm for main images and 50 µm for inserts.
