Figure 7.

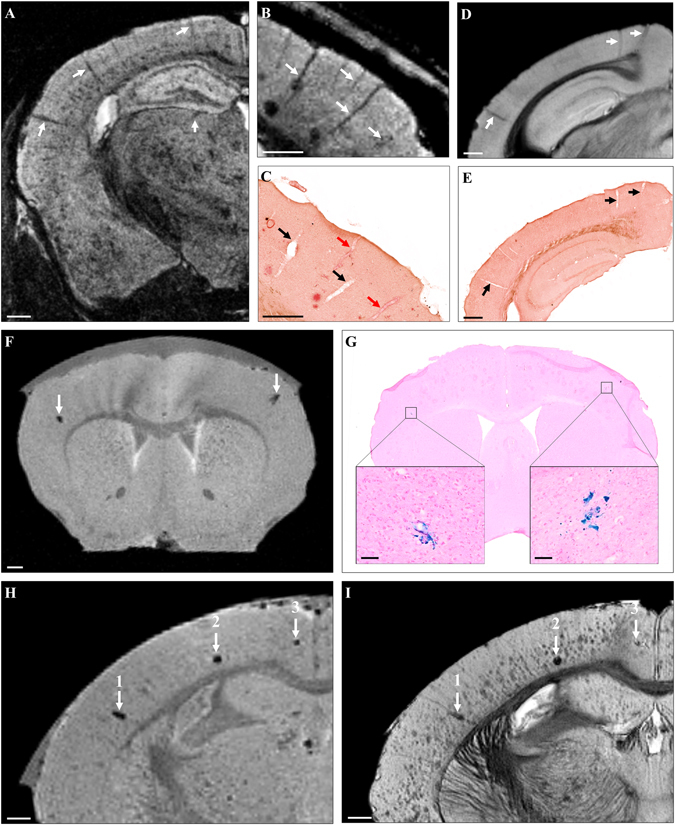
Visualization of CAA and cerebral microhemorrhages by Gd-stained MRI. Linear hypointense elements corresponding to blood vessels were detected on MR images of mouse models of amyloidosis (A–C, arrows). Registration between MR images (B) and histological sections (C) showed that some blood vessels seen on MRI were matched with CAA-positive vessels (red arrows) while some others were matched with CAA-negative vessels (black arrows). MR images of C57Bl/6 amyloid-free mice showed similar hypointensities (D, arrows) that were matched with blood vessels (E, arrows) confirming that CAA was not responsible of the hypointense nature of blood vessels by Gd-stained MRI. Sparse focal signal attenuations were observed on MR images before Gd-staining (F). They could be registered with microhemorrhages on Perls’ stained histological sections (G, boxes). Microhemorrhages easily seen on MRI before Gd-staining (H, arrows) could be matched with some hypointense spots on Gd-stained MRI (I, arrows). Large microhemorrhages (1, 2) were easily distinguished from amyloid plaques on MR images but small microbleeds (3) and amyloid plaques were similar in appearance. Scale bars: 500 µm (A–F,H,I) and 100 µm (G).
