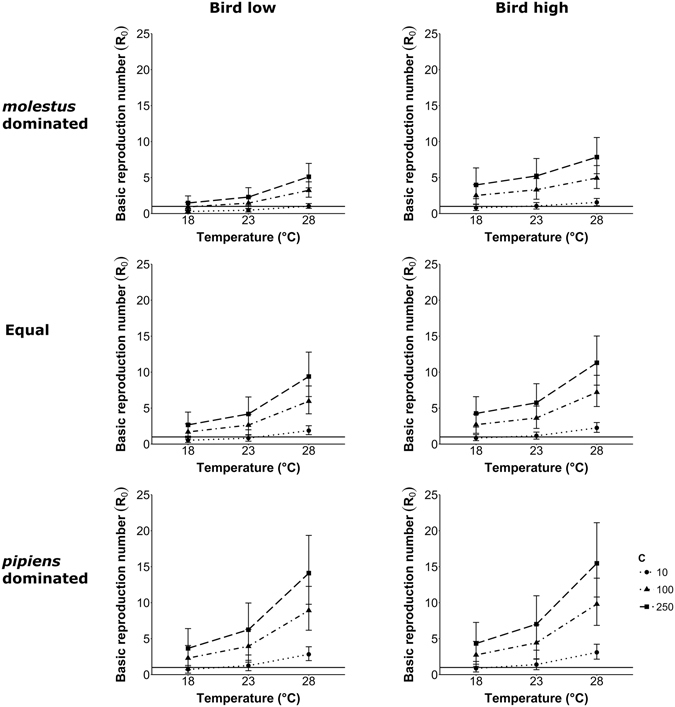
Figure 2.

Scenarios for West Nile virus transmission risk modelled with parameters relevant for Europe. The six plots show the results for low or high fractions of birds in the host population (FB = 0.2 and FB = 0.8, respectively) and one of the three different mosquito population compositions (molestus dominated, equal fractions, or pipiens dominated). Each plot shows the mean R 0 out of 100,000 model calculations, with error bars showing the 95% range of calculated R 0 values for three temperature scenarios (T = 18 °C, 23 °C, and 28 °C) and three different mosquito-to-host ratios (C = 10, 100, or 250). The horizontal line indicates an R 0 value of one. Values of R 0 above one indicate that there is a chance of West Nile virus establishment.
