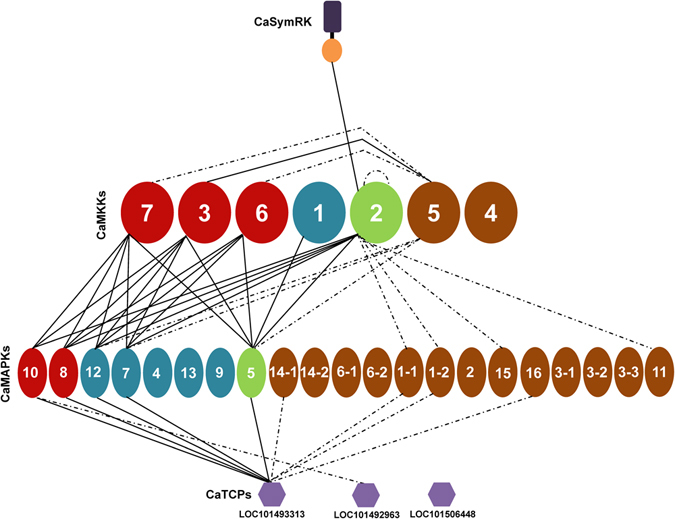
Figure 6.

Schematic representation of identified chickpea MKK-MAPK-TCP network. The interactions observed in the study have been graphically represented. The different groups of MKKs and MAPKs have been given different shades for easier visualization. Interactions that have been identified by yeast two-hybrid and verified in planta by bimolecular fluorescence complementation (BiFC) are represented by solid lines while those checked through reciprocal yeast two-hybrid assays only are represented by dotted lines.
