
Figure 2.
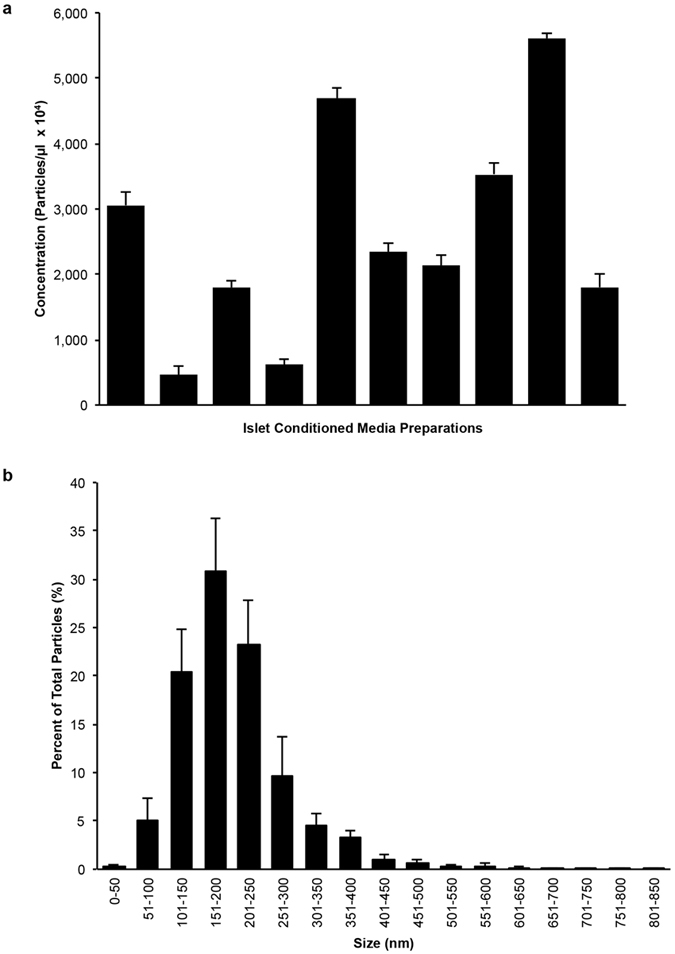
Cultured human islets produce distinct populations of particles. (a) Nanoparticle tracking analysis (NTA) graph of mean particle levels in ICM from ten donors (n = 10) shows variable levels between preparations. (b) NTA histogram of particle size distribution shows the majority of particles detected are between 100 nm and 650 nm. Data are expressed as mean ± SEM of ten donors (n = 10). At least 5 recordings, 30 seconds each were obtained for each sample at 37 °C, camera shutter speed of 30.0 ms, camera level 14 and detection threshold set to 9.