
Figure 6.
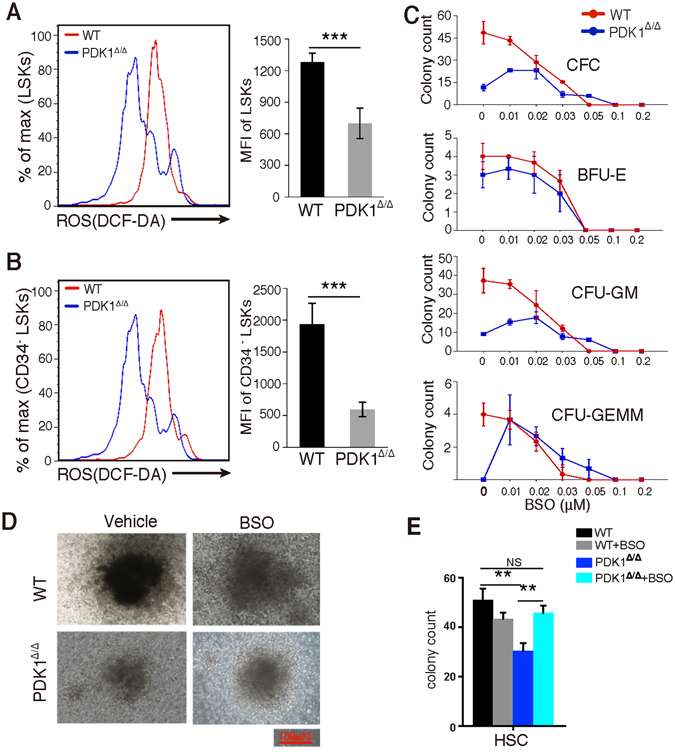
PDK1-deficient HSCs display lower ROS levels than controls. (A,B) LSKs (A) and CD34−LSKs (B) from WT or PDK1Δ/Δ mice were stained with DCF-DA and analyzed using flow cytometry. Representative histograms showed the MFI (median fluorescence intensities) of DCF-DA-labeled cells from WT or PDK1Δ/Δ mice. (C) BM cells from WT or PDK1Δ/Δ mice were treated with BSO at various concentrations for colony-forming assays. (D,E) 300 HSCs were sorted from WT or PDK1Δ/Δ mice and treated with BSO (0.02 μM) for colony-forming assays. The data are shown as the mean ± SD (n = 5); *P < 0.05; **P < 0.01; ***P < 0.001; NS, not significant.