
Figure 6.
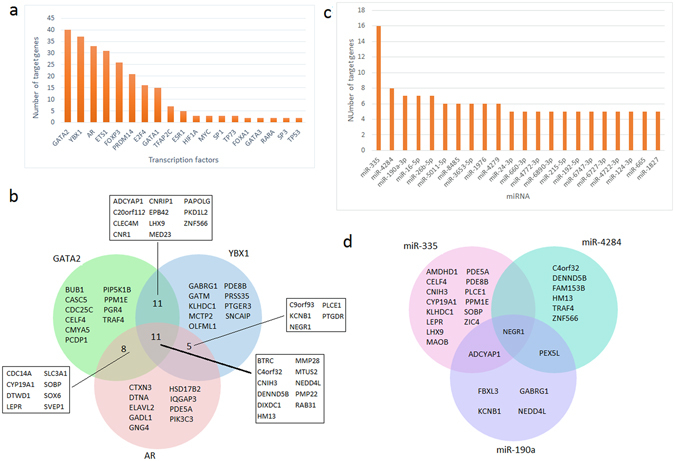
Transcriptional regulators of the prognostic genes. (a) Bar graph representing the distribution of transcription factors (TFs) which regulate the prognostic genes. (b) Venn diagram of the prognostic genes regulated by the most significant (top 3) TFs. (c) Bar graph representing the distribution of microRNAs (miRNAs) regulating the prognostic genes. (d) Venn diagram of the prognostic genes regulated by the most significant (top 3) miRNAs.