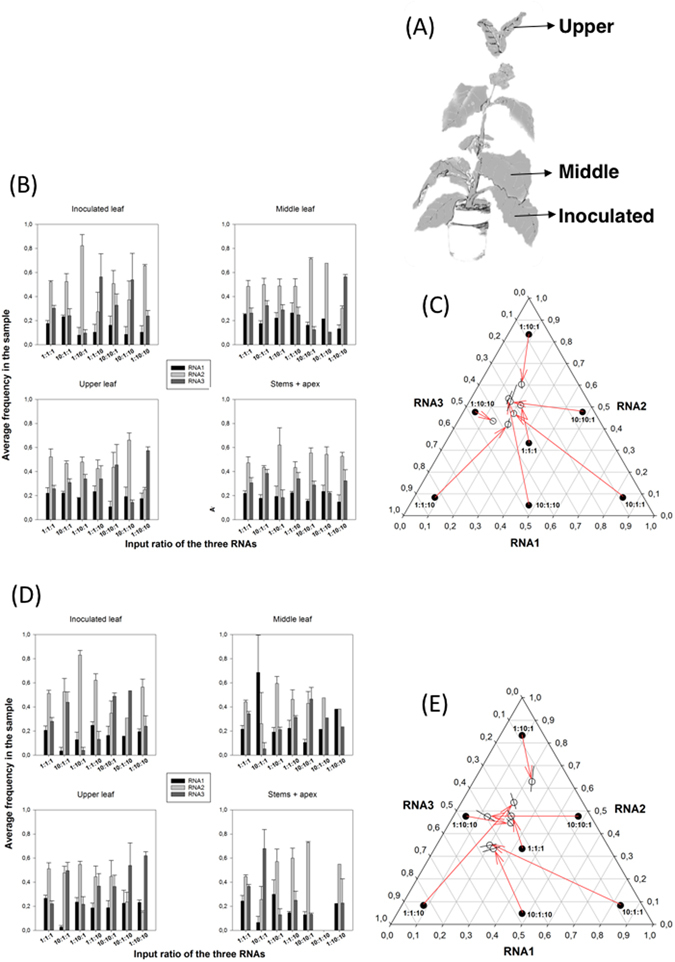
Figure 1.

Effect of differences in the input ratio of RNA segments on the outcome of AMV infection. (A) Scheme of the sampling process, with indication of the three leafs sampled. (B) Experimental determinations (by RT-qPCR) of the frequency of each one of the three RNA segments in samples of total RNA for different input ratios. Bars represent the mean of n = 3 plants; error bars represent ±1 SEM. (C) Normalized frequency ternary plot showing the estimated SGF. Solid circles represent the indicated inoculation rates. Open circles show the marginal mean estimates of relative ratios at the end of the experiment corresponding to each input ratio. Lines crossing the open circles represent the 95% Cis. Red arrows connect initial and final ratios. (D) As in (B) but determined for encapsidated RNAs. (E) As in (C) but for encapsidated RNAs.
