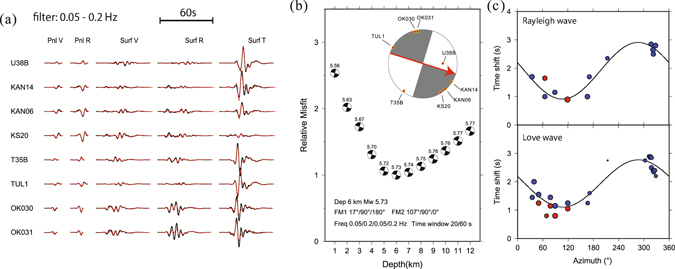
Figure 9.

Source parameter inversion for the mainshock. (a) Waveform fitting in the CAP inversion. The black and red traces are observed and synthetic velocity seismograms, respectively. (b) Waveform misfit versus centroid depth. The number above the small beach ball is the moment magnitude. Stations used in the inversion are indicated as dots on the large beach ball. Red line in the beachball indicates the preferred nodal plane, and the arrow indicates preferred rupture direction. (c) Observed (dots) and best-fitting (lines) azimuthal variation of the time shifts for Rayleigh wave (top) and Love wave (bottom). Blue and red dots indicate observed time shift without and with calibrations of a reference event, respectively. The curves show the predicted time shifts with rupture along the nodal plane with a strike of 107°. The figures are generated from GMT, which is an open source software available at: http://gmt.soest.hawaii.edu.
