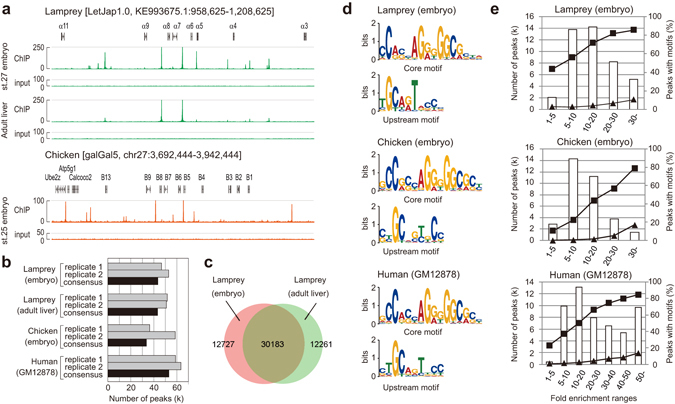
Figure 3.

ChIP-seq peaks and binding motifs in lamprey, chicken and human cells. (a) ChIP-seq results for lamprey and chicken CTCF. Shown are the lamprey Hox α cluster and chicken Hox B cluster. (b) Numbers of peaks identified by MACS2. The “consensus peaks” (black bar) were identified by taking an intersect of peaks called in each replicate and in the merged replicates (see Materials and Methods for details about peak selection). (c) Overlap of consensus peaks in the lamprey embryo and adult liver tissue. (d) CTCF core and upstream motifs identified by MEME. The motifs were identified in two parts and are almost identical between the different species analyzed (also see Supplementary Fig. S11). (e) Peaks in various fold enrichment ranges harboring the core motif and core + upstream motifs. Numbers of ChIP-seq peaks are shown with white bars. Proportions of peaks containing a core motif (▪) and those containing a core + upstream motif (▴) are indicated as lines.
