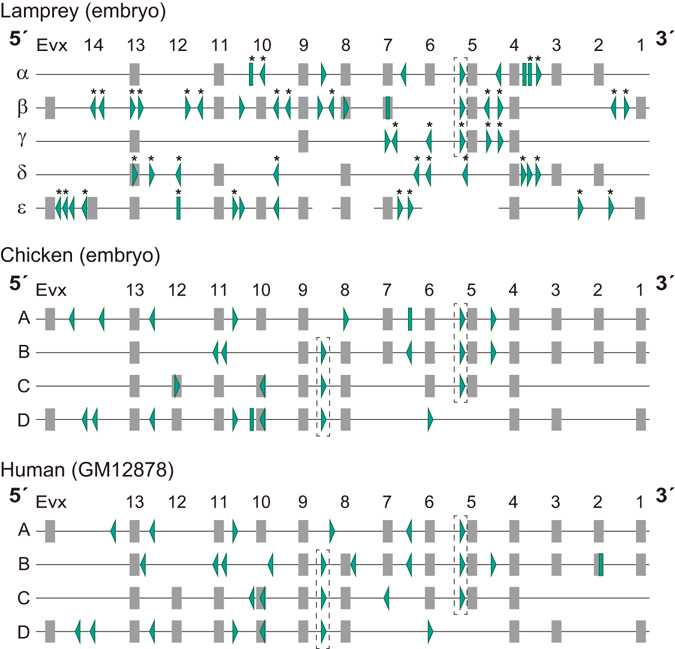
Figure 4.

Distribution of CTCF binding sites in Hox clusters. Coding region of genes are indicated with gray boxes. CTCF binding sites are indicated with green arrowheads and bars. Arrowheads indicate the orientations of core motifs inferred by the FIMO program. Green bars indicate CTCF binding sites without a core motif. CTCF binding sites of the Arctic lamprey that overlap repeats are indicated with asterisks (see Results for details). Arrowheads in dashed boxes represent shared relative positions of CTCF binding sites between multiple Hox clusters. This figure includes only “significant peaks” defined in Materials and Methods. See Supplementary Fig. S6 for an equivalent scheme in mouse, dog, and opossum, and Supplementary Fig. S7 for detailed locations of all the peaks in Hox clusters. For the Arctic lamprey, we analyzed only Hox α-ε clusters that were identified in continuous sequences harboring multiple Hox genes.
