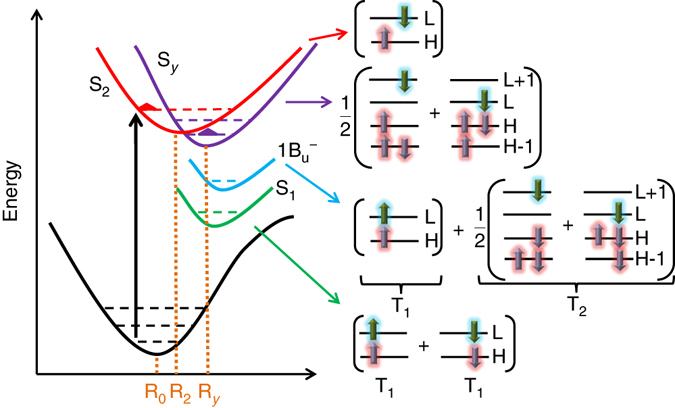
Fig. 3.

Scheme of the potential energy curves for carotenoids with N ≥ 9 (left) and the compositions of excited states (right). R0, R2, and Ry represent geometries at the potential minima of states S0, S2, and Sy, respectively. H and L represent the highest occupied and the lowest unoccupied molecular orbitals, respectively. Arrows on the orbital illustrate the population and the spins of electrons in this orbital. S2 and Sy are singly excited states. S1 (formed by two T1) and 1Bu − (formed by T1 and T2) are doubly excited states. T1 and T2 are the lowest and the second lowest triplet exciton, respectively
