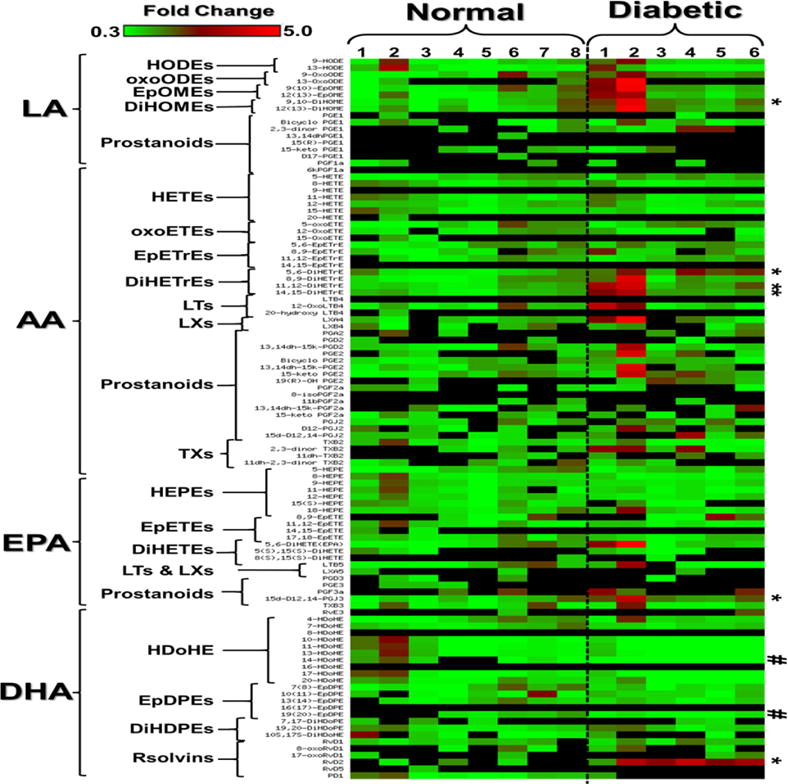
Figure 1. Clustered heat map of circulating bioactive lipid metabolites in the plasma of diabetic mice.

The metabolites were initially clustered into four major groups according to their polyunsaturated fatty acid (PUFA) origin; linoleic acid (LA), arachidonic acid (AA), eicosapentaenoic acid (EPA), or docosahexaenoic acid (DHA). This primary clustering is followed by secondary subclustering bioactive lipid metabolites within each PUFA group according to their putative enzymatic biosynthesis pathways and hence chemical structure similarity. The LA group includes the following subclusters: hydroxyoctadecadienoic acids (HODEs), oxooctadecadienoic acids (oxoODEs), epoxyoctadecamonoenoic acids (EpOME), dihydroxyoctadecamonoenoic acids (DiHOME), and LA-derived 1-series prostanoids. The AA group includes: hydroxyeicosatetraenoic acids (HETEs), oxoeicosatetraenoic acids (oxoETEs), epoxyeicosatrienoic acids (EpETrEs), Dihydroxyeicosatrienoic acids (DiHETrEs), AA-derived 4-series leukotrienes (LTs), AA-derived 4-series lipoxins (LXs), and AA-derived 2-series prostanoids and thromboxane (TXs). The EPA group includes: hydroxyeicosapentaenoic acids (HEPEs), epoxyeicosatetraenoic acids (EpETEs), dihydroxyeicosatetraenoic acids (DiHETEs), EPA-derived 5-series LTs, EPA-derived 5-series LXs, EPA-derived 3-series prostanoids, and E-series Resolvins (Rvs). The DHA group includes: hydroxydecosahexaenoic acids (HDoHEs), epoxydecosapentaenoic acids (EpDOPEs), Dihydoxydecosapentaenoic acids (DIHDOPEs), and D-series Rvs. The significant (P<0.05) increased metabolites (9,10-DiHOME, 5,6-DiHETrE, 11,12-DiHETrE, 14,15-DiHETrE, 15d-D12,14-PGJ3, and RvD2) were indicated by * while decreased metabolites were indicated by #. Data shown for the comparison are the fold change of 6 diabetic and 8 nondiabetic mice relative to the average of nondiabetic mice ± SD. The highest fold change is indicated by the red color, the lowest fold change is indicated by the green color, and the undetected metabolite is represented by the black color.
