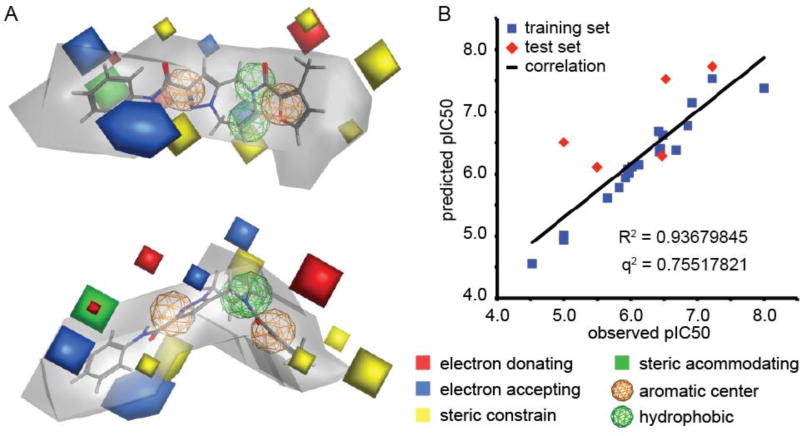
Figure 7.
Pharmacophore modeling. (A) AutoGPA-based 3D-QSAR model, shown from two rotational angels. Orange and green spheres represent aromatic and hydrophobic centers, respectively. The allowable space model is shown in grey, and electrostatically active portions are in red and blue, respectively. Areas of steric constrain (yellow) and freedom (solid green) are marked. (B) Correlation between the predicted and observed pIC50 values for the training (19 compounds) and test (6 compounds) sets. Model statistics are shown in the graph.

