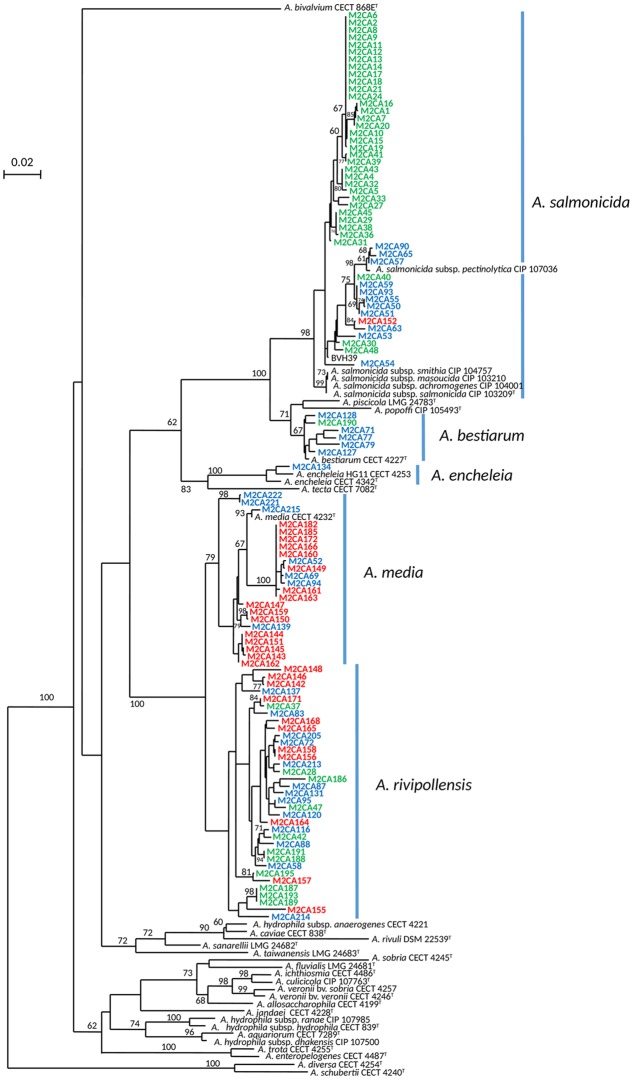
FIGURE 2.
Unrooted maximum-likelihood tree based on concatenated sequences of the two housekeeping gene fragments (1182 nt). The tree shows the structure of the studied Aeromonas spp. population (110 strains). The origin of the trains is indicated by the font color, WWTP (red font), column water (blue font) and copepods (green font). The horizontal lines represent genetic distance, with the scale bar indicating the number of substitutions per nucleotide position. The numbers at the nodes are support values estimated with 100 bootstrap replicates. Only bootstrap values > 60 are indicated on the tree. Species names corresponding to the five clusters are indicated close to the blue bar.

