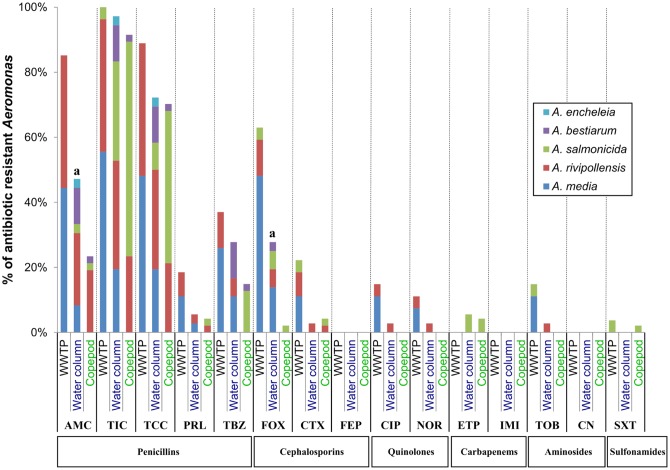
FIGURE 4.
Comparative antibiotic resistance phenotypes of Aeromonas populations from water column, copepods and WWTP. The number (n) of isolates resistant to each of the 16 antibiotics was estimated using the agar diffusion method at 22°C, for Aeromonas populations sampled from the water column (N = 36); copepods (N = 47) and the effluent of WWTP (N = 27). Percentages of strains resistant to each antibiotic within Aeromonas population corresponded n/N. aSignificant difference between percentages of resistance to an antibiotic between the Aeromonas population isolated from the water column and copepods by the chi-squared test of Fischer (P-value = 0.02 for AMC and 0.001 for FOX). AM, Ampicillin; AMC, Amoxicillin + clavulanic acid; TIC, Ticarcillin; TCC, Ticarcillin + clavulanic acid; PRL, Piperacillin; TBZ, Piperacillin + tazobactam; CTX, Cefotaxime; FOX, Cefoxitin; FEP, Cefepime; ETP, Ertapenem; IMI, Imipenem; CN, Gentamicin; TOB, Tobramycin; NOR, Norfloxacin; CIP, Ciprofloxacin; SXT, Trimetropin + sulfamethoxazole.

