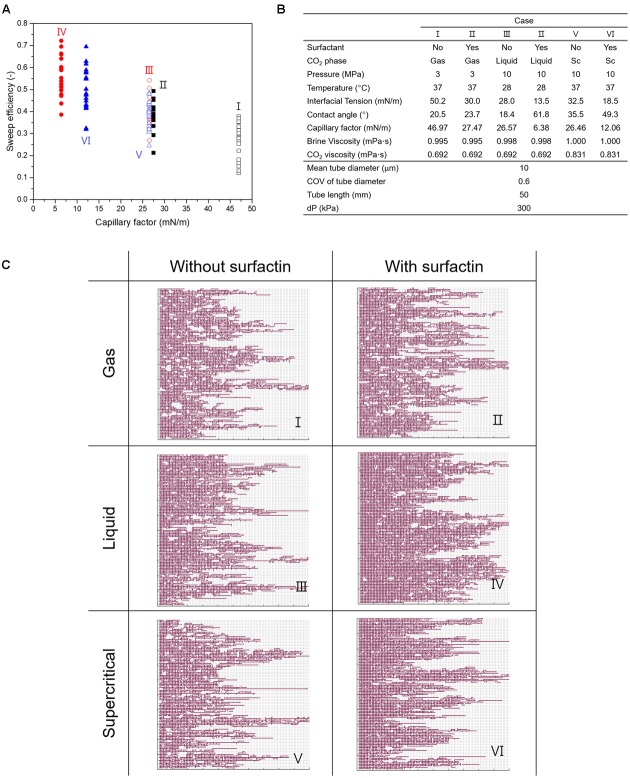
FIGURE 5.
The results of PNM simulations. (A) Variations in sweep efficiency for the different cases. (B) Input parameters for PNM simulations. (C) The invasion patterns of CO2 in pore networks with different capillary factors affected by surfactin production. Cases I, III, and V represent the conditions without surfactin production, and Cases II, IV, and VI represents the conditions with surfactin production. Gray lines indicate the brine-saturated tubes in the pore networks and the red color shows the spatial distribution of CO2. It is noted that more CO2 occupies each pore network when surfactin produced.

