Fig. 6.
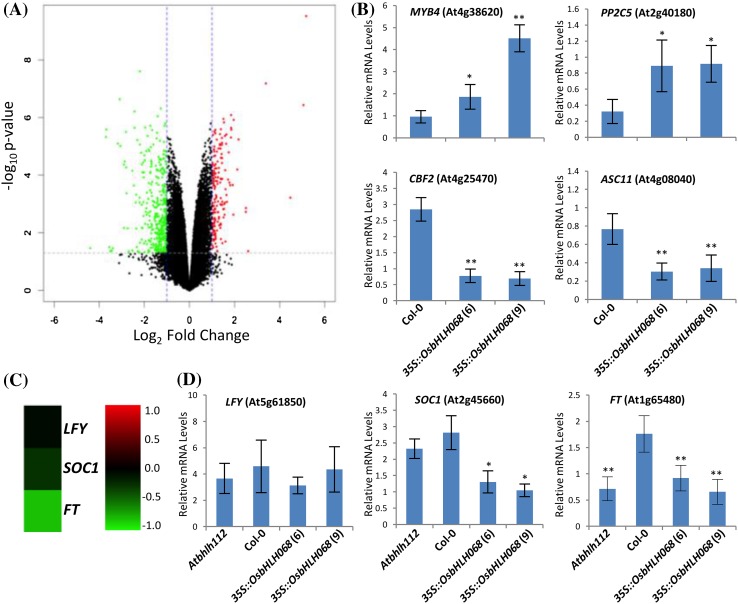
Transcriptomic analysis of the OsbHLH068-overexpressing transformant and Col-0. a Identification of DEPs. Red and green spots indicate up- and down-regulated DEPs, respectively. OsbHLH068-related DEPs are documented in Supplementary Data 1. b Quantification of MYB4, PP2C5, CBF2, and ACS11 mRNAs in two OsbHLH068-overexpressing transgenic Arabidopsis lines and Col-0 by qPCR. c Microarray expression analysis of LFY, SOC1, and FT in OsbHLH068-overexpressing transgenic Arabidopsis plants. The scale bar shows log2-fold changes. Red and green colors indicate increased and decreased gene expression. d Quantification of LFY, SOC1, and FT mRNAs in Atbhlh112, Col-0, and two OsbHLH068-overexpressing transgenic Arabidopsis lines by qPCR. The total RNA used in the microarray and qPCR assays was extracted from the same aerial tissues of 17-day-old seedlings. The values presented in b and d are the mean ± SE of 4 biological replicates, each with two technical replicates. *P < 0.05; **P < 0.01, Student’s t-test. Atbhlh112 mutant, SALK_148540

