Figure 3.
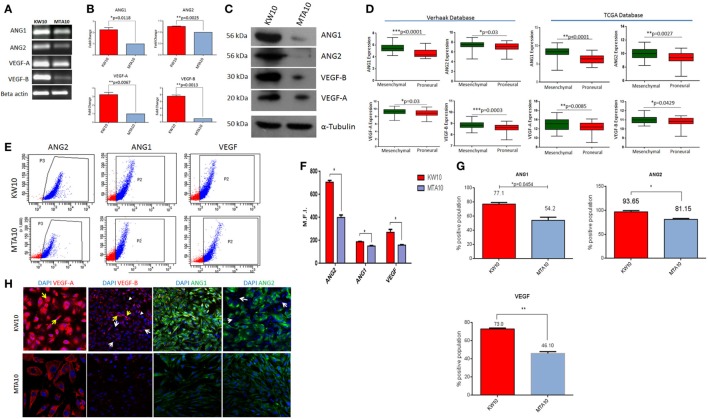
A minimal multigene signature (MMS) correlates with molecular subtypes in glioblastoma cultures. (A) RT-PCR analyses of the expression of angiopoietin 1 (ANG1), angiopoietin 2 (ANG2) and vascular endothelial growth factor A (VEGF-A), vascular endothelial growth factor B (VEGF-B). (B) qRT-PCR quantification of MMS glioblastoma. Normalized fold change is expressed in MTA10 cultures and is presented as mean ± SEM (n = 3). (C) Western blotting of angiogenesis-specific proteins in both cultures. (D) Validation of MMS glioblastoma in two independent glioblastoma data sets [TCGA, Verhaak (5, 6)]. (E) Scatter plots for ANG1, ANG2, and VEGF expression using flow cytometry and (F) quantification of mean fluorescence intensities (MFI) (n = 3). (G) Bar graph depicting percentages of positive cells in each gene belonging to MMS (n = 3 and data represented as mean ± SEM values; *p < 0.01). (H) Confocal imaging of immunostaining of MMS gene expression; arrows indicate cells showing differential expression of these proteins (white arrows, expression lacking cells; arrow heads, weakly expressing cells; and yellow arrows, highly expressing cells). Nuclear staining was performed using DAPI. Magnification ×63.

