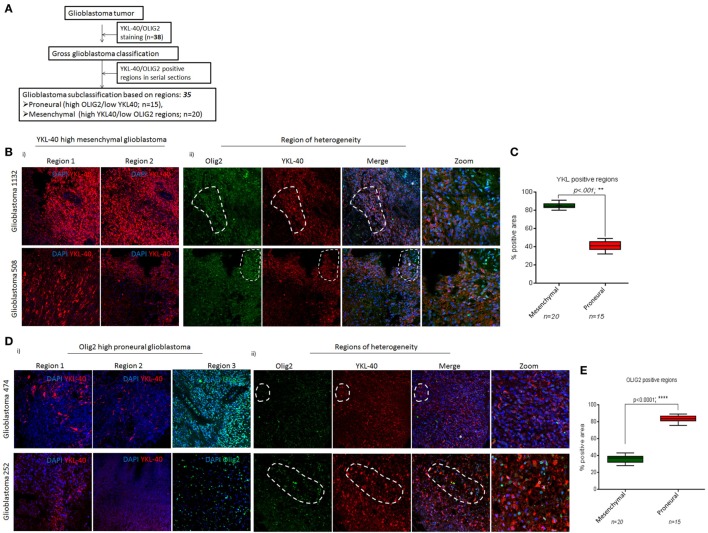
Figure 4.
YKL-40 and OLIG2 positivity delineates mesenchymal and proneural glioblastoma subtypes. (A) Strategy for subtyping of glioblastoma tumors. (B) Immunohistochemistry shows bright YKL-40-positivity regions (i) and regions-of-heterogeneity (ROH) showing coexpression of both YKL-40 and OLIG2 in tumor cells (ii). (C) Semiquantitative analysis of YKL-40 immunostained areas for glioblastoma subclass segregation. Percent-positive areas are calculated from data shown in B and are plotted as mean ± SEM from glioblastoma samples (n = 35), **p < 0.001. (D) YKL-40 and OLIG2 immunostaining in glioblastoma tumors (i), ROH as areas with cancer cells coexpressing both YKL-40 and OLIG2 proteins (marked areas) (ii). (E) Semiquantitative analysis of OLIG2 immunostained areas for glioblastoma segregation. Percent-positive areas are calculated from (D). Data are plotted as mean ± SEM from glioblastoma samples (n = 35), ****p < 0.0001. Magnification ×63. Sections were mounted in antifade mounting medium and acquired on a LSM 510, confocal microscope (Carl Zeiss AG).

