
FIGURE 1.
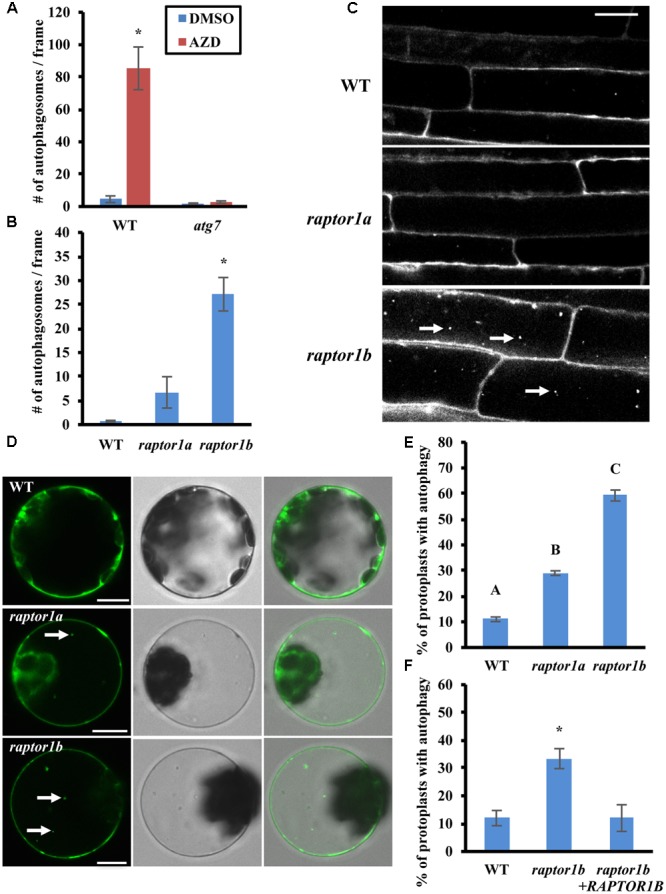
Inhibition of TOR or RAPTOR leads to constitutive autophagy. (A) The TOR inhibitor AZD8055 induces autophagy. 7-day-old WT (Col-0) and atg7 mutant seedlings were treated with DMSO or AZD8055 (AZD) for 2–3 h, stained with MDC and then observed and imaged by fluorescence microscopy. The number of puncta in each image was counted and averaged from at least 10 images per genotype for each condition. (B,C) Autophagy is induced in raptor1b mutant root cells under standard growth conditions. (B) 7-day-old WT, raptor1a and raptor1b knockout mutant seedlings were stained with MDC and observed by fluorescence microscopy. The number of puncta in each image was quantified as in (A). (C) Representative confocal images of MDC-stained WT, raptor1a and raptor1b mutant seedlings. MDC-stained autophagosomes appear as white puncta within cells as indicated by white arrows. Scale bar = 20 μm. (D,E) Leaf protoplasts of raptor1a and raptor1b mutants have constitutive autophagy. (D) Transient expression of a GFP-ATG8e fusion protein in leaf protoplasts of WT and RAPTOR mutants, observed by confocal microscopy. GFP-tagged autophagosomes appear as green puncta within leaf protoplasts in the left column as indicated by white arrows. The middle and right columns show DIC and merged images respectively. Scale bar = 10 μm. (E) Quantification of D. Protoplasts were observed using epifluorescence microscopy. The percentage of protoplasts with more than three visible GFP-tagged autophagosomes was calculated, with 100 protoplasts observed per genotype for each condition. (F) Expression of the RAPTOR1B cDNA complements the raptor1b constitutive autophagy phenotype. A GFP-ATG8e fusion protein was transiently expressed in raptor1b mutant leaf protoplasts with or without full-length RAPTOR1B, expressed from a 35S constitutive promoter, or in WT protoplasts as a control. Protoplasts were observed using epifluorescence microscopy. The percentage of protoplasts with more than three visible GFP-tagged autophagosomes was quantified as in (E). For all graphs, error bars indicate means ± standard error (SE) from three independent replicates. Asterisks or different letters indicate statistically significant differences (P < 0.05) using Student’s t-test compared with WT under control conditions.