
FIGURE 2.
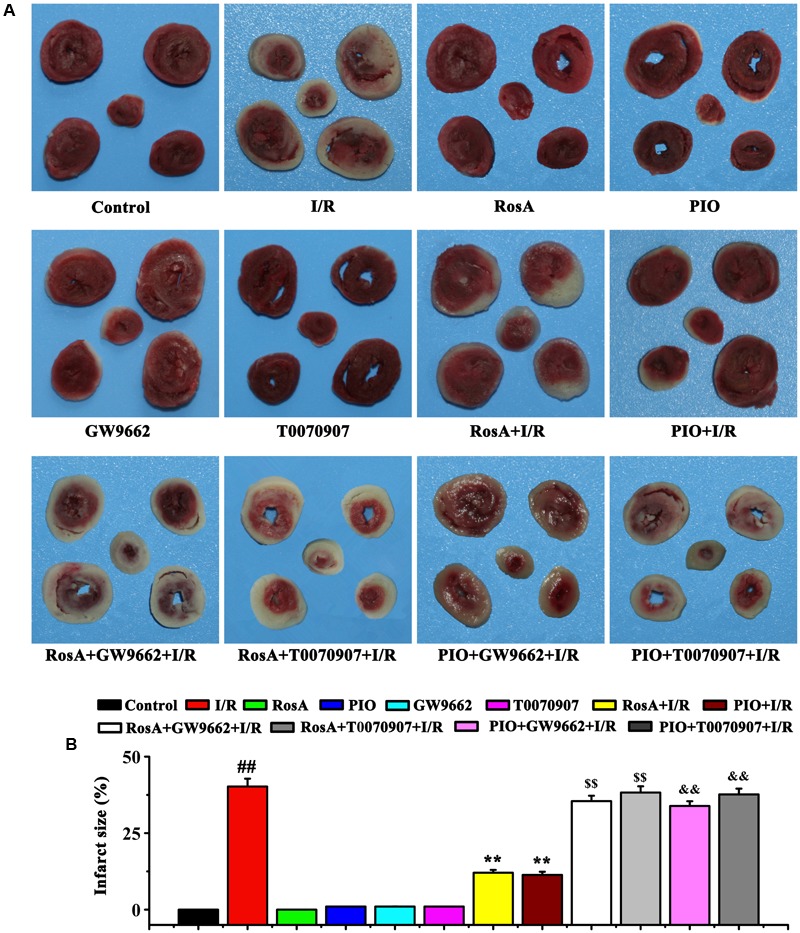
The effect of RosA on the size of I/R-induced infarcts. (A) The infarct size was measured by TTC staining. (B) Statistic analysis of the size of I/R-induced infarcts. ##P < 0.01 compared to the control group; ∗∗P < 0.01 compared to the I/R group. Compared with the I/R+RosA group, $P < 0.05, $$P < 0.01. Compared with the I/R+PIO group, &P < 0.05, &&P < 0.01.