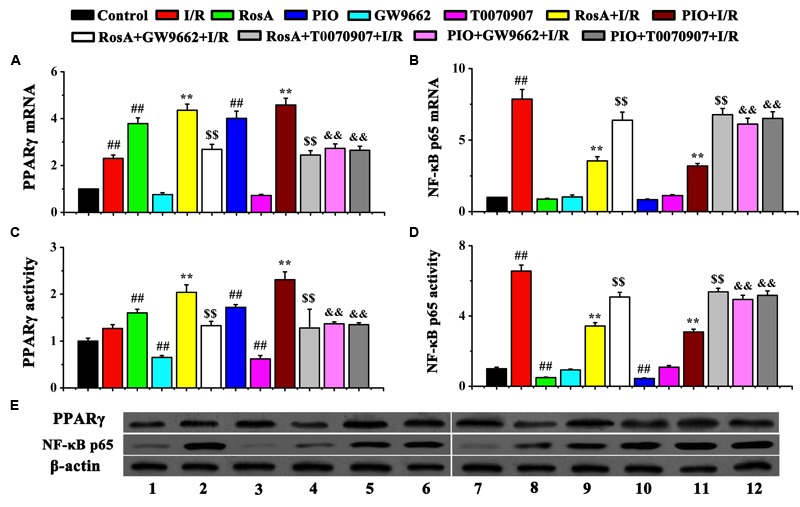
FIGURE 5.

The effect of RosA on the mRNA levels and protein levels of PPARγ and NF-κB p65 in rat cardiac tissue. (A) The effect of RosA on the mRNA levels of PPAR-γ; (B) The effect of RosA on the mRNA levels of NF-κB p65; (C) Quantitative analysis of PPARγ protein levels; (D) Quantitative analysis of NF-κB p65 protein levels. (E) Measurement of PPARγ and NF-κB p65 protein levels in rat hearts by Western blot. (1) Control group; (2) I/R group; (3) RosA group; (4) GW9662 group; (5) RosA+I/R group; (6) RosA+GW9662+I/R group; (7) PIO group; (8) T0070907 group; (9) PIO+I/R group; (10) RosA+T0070907+I/R group; (11) PIO+GW9662+I/R group; (12) PIO+T0070907+I/R group. ##P < 0.01 compared to the control group; ∗∗P < 0.01 compared to the I/R group. Compared with the I/R+RosA group, $P < 0.05, $$P < 0.01. Compared with the I/R+PIO group, &P < 0.05, &&P < 0.01.
