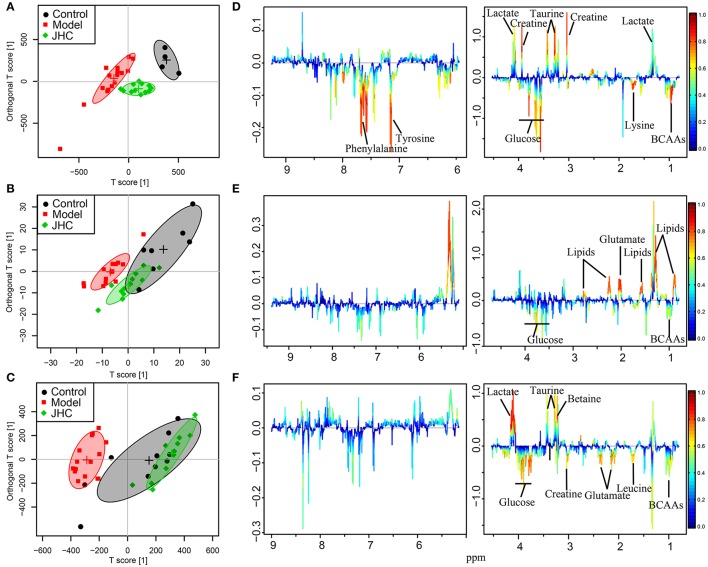
Figure 8.
OPLS-DA analyses of metabolic profiles between control, model and the JHC groups for intestine, kidney, and spleen. Score plots (A) and color-coded coefficient loadings plots (D) for intestine (R2 = 0.80, Q2 = 0.63). Score plots (B) and color-coded coefficient loadings plots (E) for kidney (R2 = 0.65, Q2 = 0.49). Score plots (C) and color-coded coefficient loadings plots (F) for spleen (R2 = 0.82, Q2 = 0.56). Significantly changed metabolites were assigned in the loadings plots. Negative signals represent increased and positive signals represent decreased concentrations in model group. Symbols of • (black filled circles),  (red filled squares), and
  (green filled rhombuses) represent the control, model, and JHC groups, respectively.

