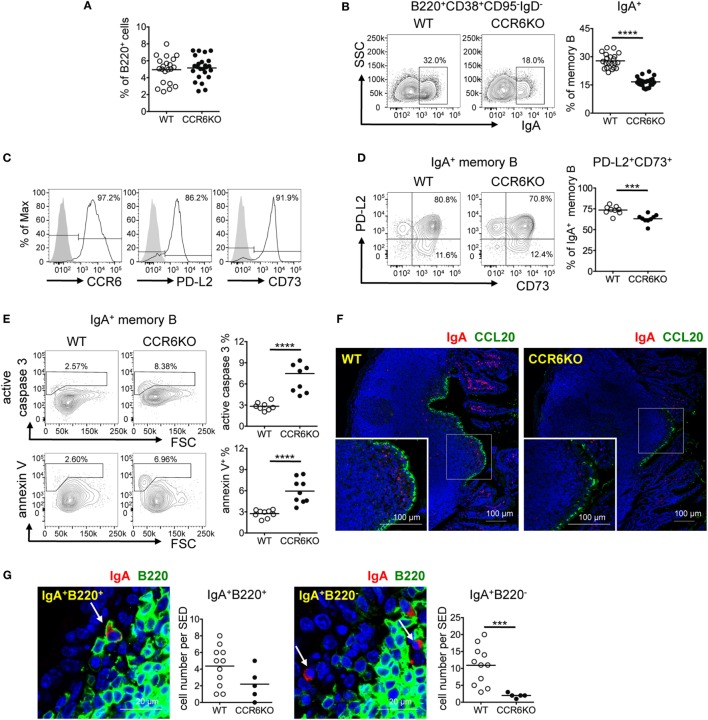
Figure 4.
CCR6−/− mice show decreased IgA-bearing memory B cells in Peyer’s patches (PPs). (A–E) PP lymphocytes from WT and CCR6−/− mice were subjected to FACS analysis of memory B cells. The frequencies of total memory B cells (B220+CD38+CD95−IgD−) (A) and IgA-bearing memory B cells (B) are shown. Representative histograms indicating the expression of CCR6, PD-L2, and CD73 on IgA-bearing memory B cells are shown (C). Representative contour plots (left panel) and the frequency of PD-L2 and CD73 double-positive, IgA-bearing memory B cells in WT and CCR6−/− mice (right panel) are shown (D). Representative contour plots and the frequency of IgA-bearing memory B cells positive for active caspase 3 and annexin V in WT and CCR6−/− mice are shown (E). (F,G) Sections of paraffin-embedded PPs from WT and CCR6−/− mice were subjected to immunofluorescence assay (IFA) for the detection of IgA (red) and CCL20 (green) (F) or IgA (red) and B220 (green) (G). PPs from four mice (WT n = 2, CCR6−/− n = 2) were processed and examined. Representative IFAs from cryosection of the distal part of small intestine are shown (F). IgA+B220+ cells (left panel) and IgA+B220− cells (right panel) in the subepithelial dome (SED) of WT PPs are shown. The quantification of the IgA-bearing cells was performed by counting cells within the SED, which is depicted as a more diffuse area immediately underneath follicle-associated epithelium. The results obtained from one pair of WT and CCR6−/− mice are shown (G). Each symbol represents one mouse (A–E). Each symbol represents one SED (G). Data are a compilation of six (A,B), two (D), or three (E) independent experiments (***p < 0.001; ****p < 0.0001).

