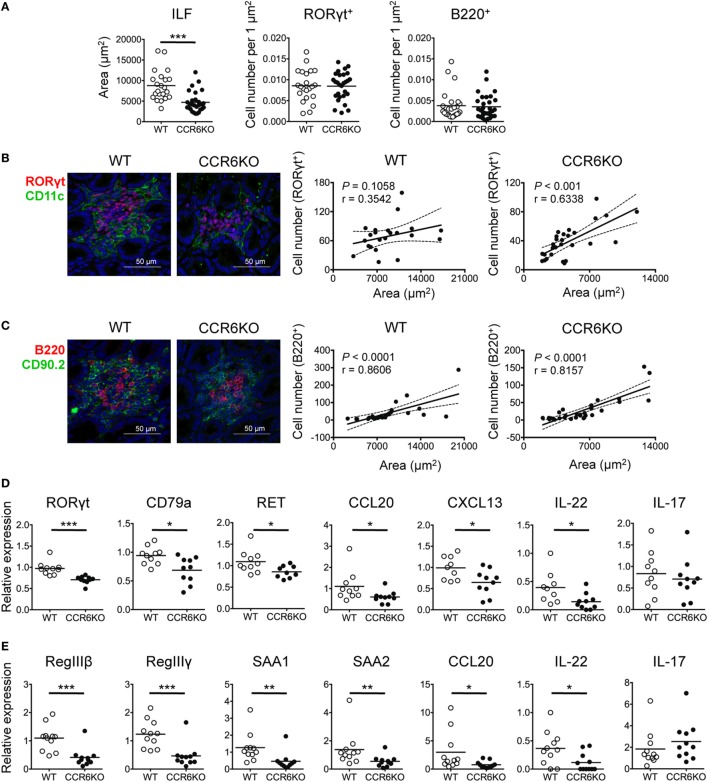
Figure 8.
CCR6−/− mice show small-sized isolated lymphoid follicles (ILFs) and reduced expression of genes involved in epithelial defense. (A–C) Cryosections of ileum from WT and CCR6−/− mice were subjected to immunofluorescence assay (IFA) to detect ILFs. ILFs were defined as lymphoid aggregates with surface areas between 2,000 and 20,000 µm2. ILFs were stained for RORγt (red) and CD11c (green) [(B), left panel] or B220 (red), CD90.2 (green), and CD3e (no signal, data not shown) [(C), left panel]. Quantification of ILF surface areas [(A), left panel] and the frequencies of RORγt+ cells and B220+ cells in ILFs are shown [(A), middle and right panels]. (B,C) Representative IFA of ILFs in the ilea of WT and CCR6−/− mice are shown [(B,C), both left panel]. The scatter plots show the correlation between RORγt-expressing cells and ILF surface area in WT [(B), middle panel] or CCR6−/− [(B), right panel] mice. The scatter plots show the correlation between B220-expressing cells and ILF surface area in WT [(C), middle panel] or CCR6−/− [(C), right panel] mice. The number of RORγt+ cells or B220+ cells was counted in a given area of tissue sections from two mice in each group; the data shown are the results of Spearman correlation test with regression line (solid line), 95% confidence interval (dashed line), P value, and correlation coefficient (r). Each symbol represents one ILF. (D,E) Total RNA extracted from ileum scrapes and crypts of WT and CCR6−/− mice was subjected to reverse transcription into cDNA followed by quantitative PCR analysis. Relative gene expression was normalized to the level of GAPDH and compared to expression in WT mice. The expression of various genes in crypts (D) and scrapes (E) is shown. Each symbol represents one mouse. Data are a compilation of three (D) or four (E) independent experiments (*p < 0.05; **p < 0.01; ***p < 0.001; ****p < 0.0001).

