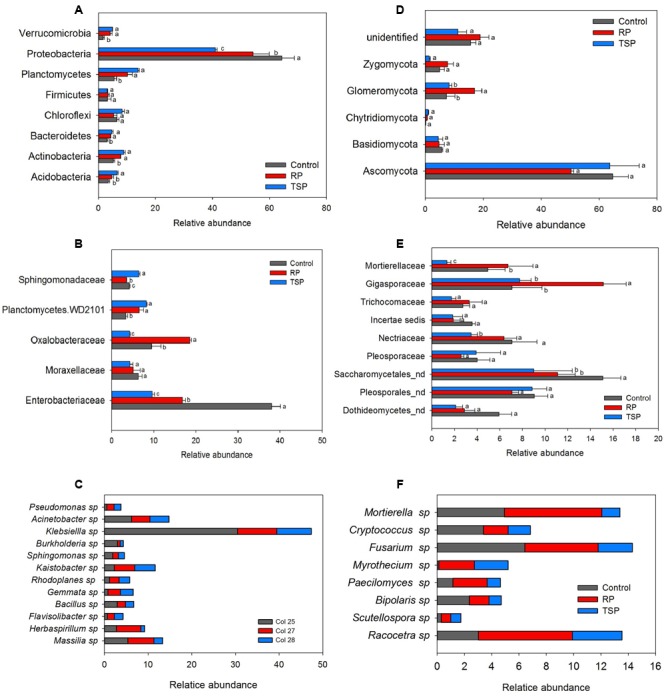
FIGURE 2.

Relative abundance of (A) bacterial phyla, (B) families, and (C) genera. (D) Fungal phyla, (E) families, and (F) genera. Taxa occurring in at least one condition with an abundance greater than 3% were considered, and variance analysis was performed between P treatments, followed by Scott Knott test at 5%. For each taxon, means with the same letter are not significantly different. Control, treatment without added P; RP, treatment with rock phosphate; TSP, treatment with triple superphosphate; nd, identification was not possible at the family level.
