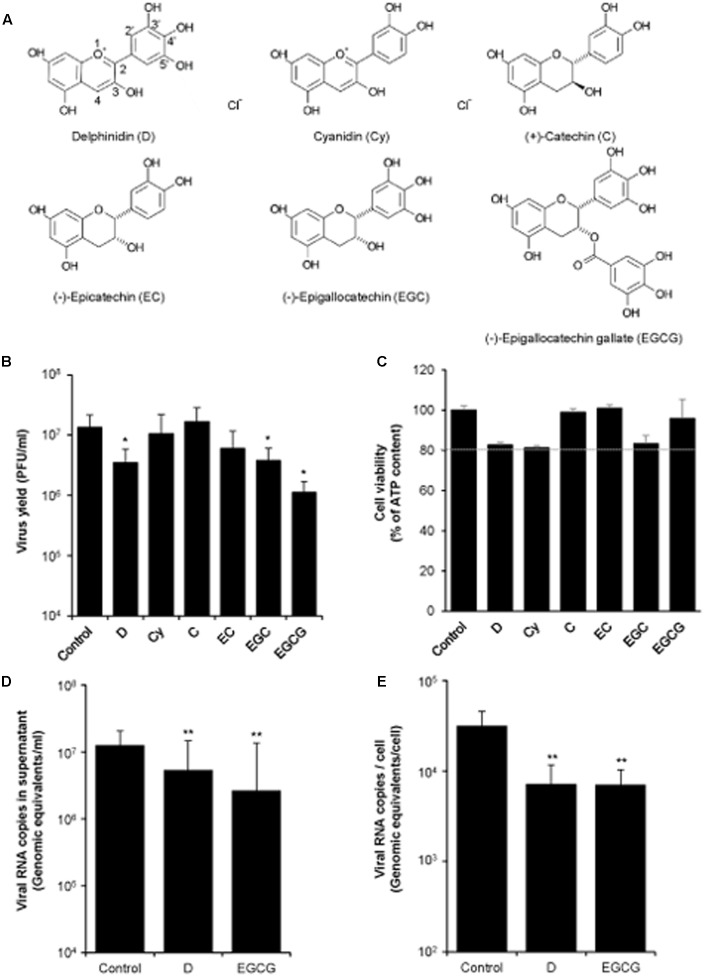
FIGURE 1.
Effect of different polyphenols on WNV infection. (A) Schematic representation of the different polyphenols tested. (B) Vero cells were infected with WNV NY99 (MOI of 0.5 PFU/cell) and the different polyphenols (10 μM) were added after the first hour of infection (adsorption time). Virus yield in culture supernatant was determined by plaque assay at 24 h p.i. (C) Mock-infected Vero cells were treated (24 h) in parallel with 10 μM of each polyphenol and the cell viability was determined by measuring the cellular ATP content. Dashed line indicates 80% of cell viability of control cells. (D) Quantification by qRT-PCR of genome-containing particles in culture supernatant of Vero cells infected and treated as in (B). (E) Amount of cell-associated viral RNA in cell cultures infected and treated as in (B) determined by qRT-PCR at 24 h p.i. Data are represented as mean + SD. Statistically significant differences are indicates: ∗P < 0.05; ∗∗P < 0.005.

