
FIGURE 1.
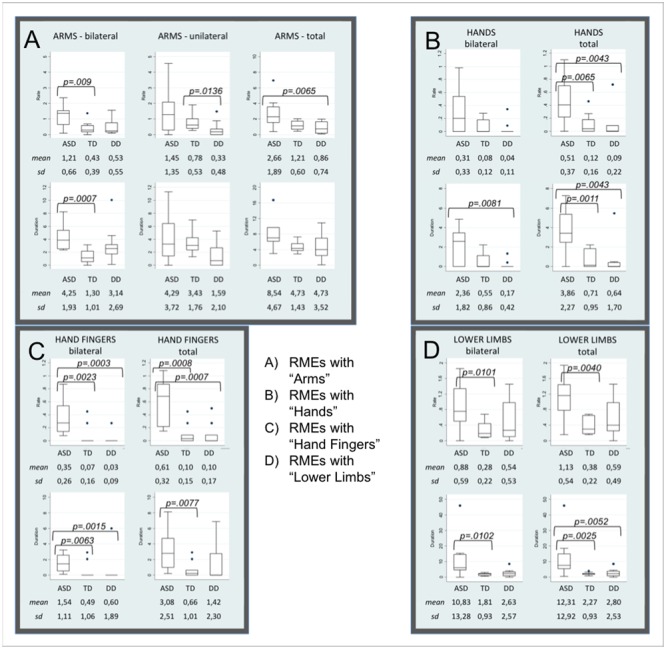
Box Plots of items distribution by groups. Box Plots show the distribution of each parameter in Autism Spectrum Disorders (ASD), Typical Development (TD), and Developmental Delay (DD) subjects. (A–D) Shown mean and standard deviation of the rate and the duration of RMEs with Arms (bilateral, unilateral, and total, A), Hands (bilateral and total, B), Fingers (bilateral and total, C), Lower Limbs (bilateral and total, D). The line in the middle of the box represents the median. The box extends from the 25th percentile (x[25]) to the 75th percentile (x[75]), the so-called interquartile range (IQ). The lines emerging from the box extend to the upper and lower adjacent values. The upper adjacent value is defined as the largest data point less than or equal to x[75] + 1.5 IQ. The lower adjacent value is the smallest data point greater than or equal to x[25] – 1.5 IQ. Dots indicate observed data points more extreme than the adjacent values (referred to as outliers).