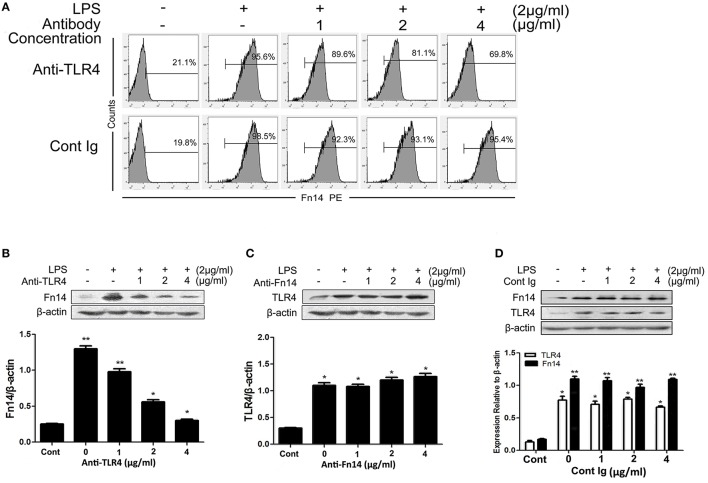
Figure 3.
The expression of Fn14 and TLR4 protein in LPS-stimulated SIEC02 in the presence of anti-TLR4 or anti-Fn14 antibody. The porcine small intestine epithelial cell line SIEC02 were stimulated with LPS in the presence of increasing concentrations of either anti-TLR4 or anti-Fn14 antibody for 24 h, and flow cytometric assay was used to detect the super Fn14 expression (A) and Western blot assay was used to detect the total cellular expression levels of Fn14 (B) or TLR4 (C) protein in the cells. The expression of either Fn14 or TLR4 in SIEC02 treated with different concentrations of isotype antibody was used as control (D). Representative blots are shown in the upper panel and the histograms in the under panel show the results of densitometric analysis of Fn14 and TLR4 expression (normalized to β-actin to correct for protein loading). The data represent the mean ± SEM (n = 3). *P < 0.05, **P < 0.01, compared with data on untreated cells.

