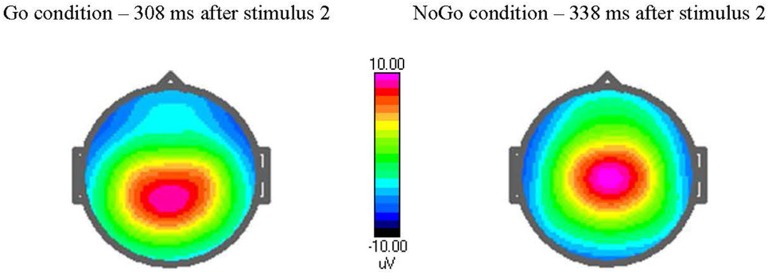
Figure 1.
Amplitude voltage map [in μvolts (μV)] at peak latency in Go and NoGo trials. The cued Go NoGo task elicits a maximum Go P3-component after 308 ms when stimulus 2 is target (Go condition) and a NoGo P3-component after 338 ms when stimulus 2 is non-target. Observe the topography of the P3, with a maximum at more parietal site in Go condition and centrally in NoGo condition.

