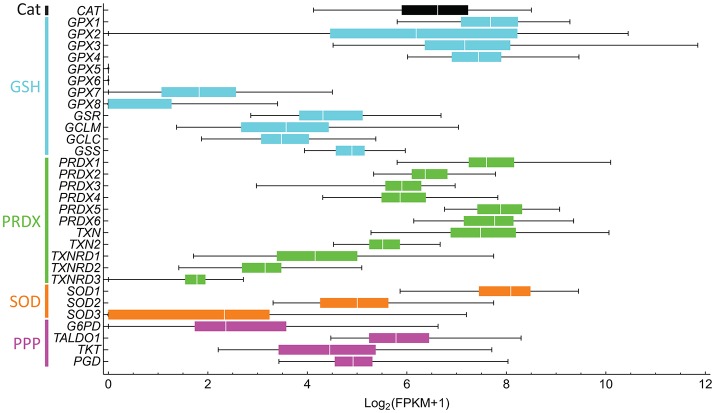
Figure 5.
Antioxidant gene expression greatly varies between liver hepatocellular carcinoma in different subjects. The gene expression of 50 subjects was downloaded from NCI's Genomic Data Commons, and fragments per kilobase transcript per million (FPKM) were computed. FPKM-values lower than one were considered to be non-expressed and were assigned a value of 0. The Log2(FPKM + 1) were then computed. Bars are colored according to processes of the same pathway, as indicated on the left. Genes and respective proteins: CAT, catalase; GPX1-8, glutathione peroxidase; GSR, glutathione reductase; GCLM and GCLC, glutamate-cysteine ligase modifier and catalytic subunits, respectively; GSS, glutathione synthetase; PRDX1-6, peroxiredoxin; TXN and TXN2, thioredoxin; TXNRD1-3, thioredoxin reductase; SOD, superoxide dismutase; G6PD, glucose-6-phosphate dehydrogenase; TALDO1, transaldolase 1, TKT, transketolase, and PGD, 6-phosphogluconate dehydrogenase.

