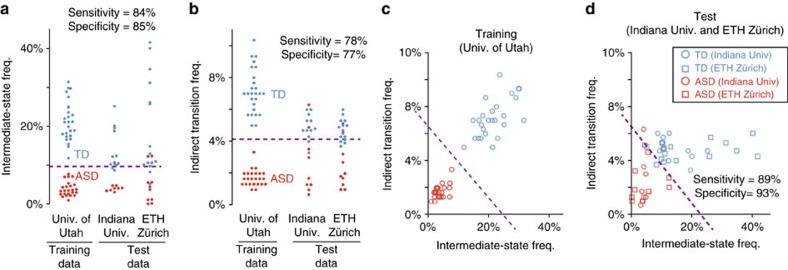
Figure 9. Diagnosis prediction.
The thresholds for the diagnostic prediction were defined in the training data, and subsequently evaluated in the independent test data (Supplementary Fig. 10). The two indices of brain dynamics for the test data were calculated for each participant. Therefore, the accuracy of model fit in the energy-landscape analysis (ca. 80%) was not so high as in the group-level analysis (ca. 95%). (a,b) The cutoff values for the univariate diagnosis predictions were 7.7% for the intermediate-state frequency (a) and 4.15% for the indirect transition frequency (b). (c,d). The cutoff line for the bivariate prediction (purple line; c) was defined by training a linear support vector machine with the University of Utah data set. This line could classify individuals in the independent data sets with a relatively high accuracy (d). Univ., University.

