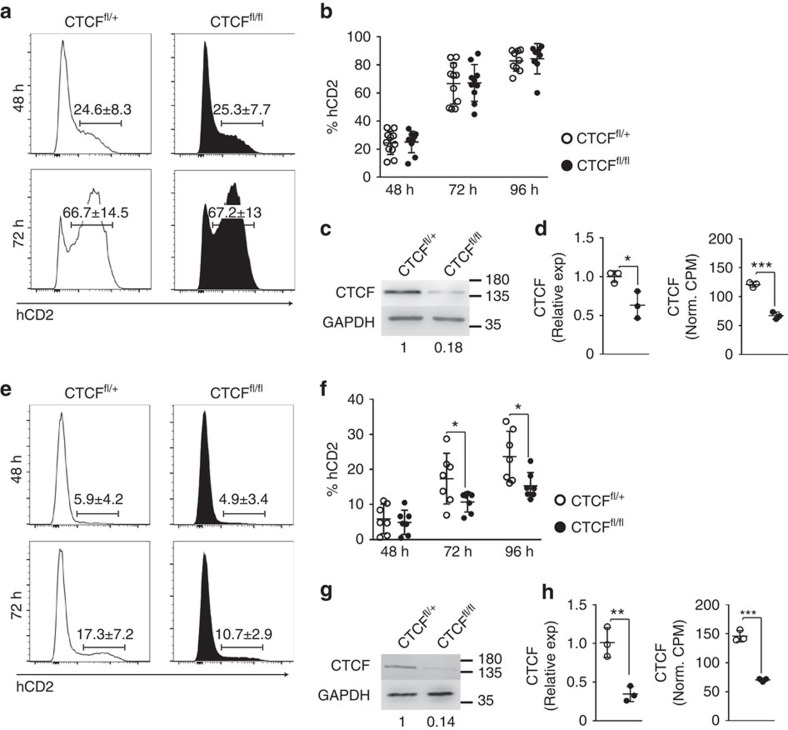
Figure 2. Activation context determines the requirement of activated B cells for CTCF.
(a) hCD2 expression in spleen B cells from CTCFfl/+ and CTCFfl/fl mice after 48 and 72 h of LPS/IL4 stimulation. (b) Quantification of hCD2+ cells from CTCFfl/+ and CTCFfl/fl mice after 48, 72 and 96 h of LPS/IL4 stimulation. n(CTCFfl/+)=11; n(CTCFfl/fl)=10. (c) Western blot analysis of CTCF in isolated hCD2+ B cells from CTCFfl/+ and CTCFfl/fl mice after 72 h of LPS/IL4 stimulation. CTCF amount normalized to GAPDH is shown underneath. (d) CTCF mRNA quantification by qRT-PCR (P=0.0283) and by RNA-seq (P=0.0003). (e) hCD2 expression in spleen B cells from CTCFfl/+ and CTCFfl/fl mice after 48 and 72 h of stimulation in CD3/CD28 T–B co-cultures. Histograms show hCD2 expression gated on B220+ B cells. (f) Quantification of hCD2+ cells from CTCFfl/+ and CTCFfl/fl mice after 48, 72 and 96 h of CD3/CD28 T-cell stimulation. Percentages of hCD2+ cells gated on B220+ B cells are shown. n(CTCFfl/+)=7; n(CTCFfl/fl)=7. P(72 h)=0.0438; P(96 h)=0.0187. (g) Western blot analysis of CTCF in isolated hCD2+ B cells from CTCFfl/+ and CTCFfl/fl mice after 72 h of stimulation with CD3/CD28 and T cells. CTCF amount normalized to GAPDH is shown underneath. (h) mRNA CTCF quantification by qRT-PCR (P=0.0059) and by RNA-seq (P=0.0002). Mean values (a and e) ±s.d. are shown. CTCFfl/+, white dots; CTCFfl/fl; black dots. Statistical analysis was done with two-tailed unpaired Student’s t-test.

