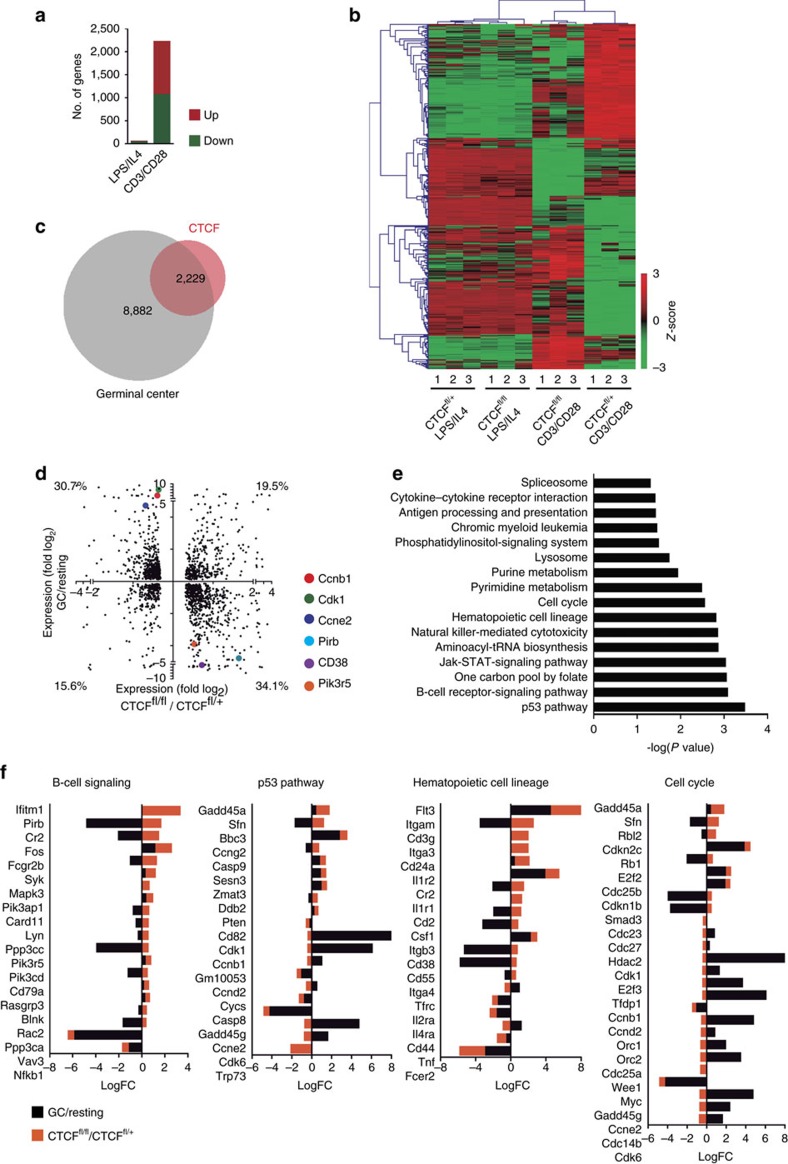
Figure 4. CTCF transcriptionally regulates B cell signalling and cell cycle.
RNA-seq analysis was performed in triplicates from hCD2+ sorted B cells from CTCFfl/fl and CTCFfl/+ mice after 48 h stimulation in the presence of CD3/CD28 T or LPS/IL4. Differentially expressed genes (adjusted P<0.05) were subject to further analysis. (a) Number of differentially transcribed genes between CTCFfl/fl and CTCFfl/+ B cells stimulated LPS/IL4 (50 differentially expressed genes) or CD3/CD28 stimulation (2,229 differentially expressed genes) conditions. Red: upregulated genes; green: downregulated genes. Adjusted P<0.05. See Supplementary Data 1 and Supplementary Data 2 for complete list of genes. (b) Heatmap analysis of the 20% most differentially expressed genes between CTCFfl/fl and CTCFfl/+ B cells after CD3/CD28 T stimulation. Z-scores values are represented. Clustering was performed using the average linkage method based on Pearson correlation distance. Each column represents an independent replicate. (c) Overlap between genes differentially expressed in GC reaction (wild-type GC B cells versus wild-type-resting B cells, grey circle) and genes differentially expressed upon CTCF depletion in CD3/CD28 T-stimulated B cells (CTCFfl/fl versus CTCFfl/+ hCD2+ sorted B cells, red circle). (d) Two-dimension expression plot. X axis, log2 fold values of significantly changed genes upon CTCF deficiency (CTCFfl/fl versus CTCFfl/+, CD3/CD28-stimulated B cells). Y axis, log2 fold values of significantly changed genes in GC versus resting B cells. Percentage of genes in each quadrant is shown. (e) KEGG pathway enrichment analysis of genes differentially expressed in CTCFfl/fl versus CTCFfl/+ CD3/CD28-stimulated B cells. (f) Log fold change (LogFC) representation of the genes included in the KEGG pathways analysed in (e). Black, GC versus resting B cells fold change. Orange, CTCFfl/fl versus CTCFfl/+ CD3/CD28 T-stimulated splenic B cells fold change.

