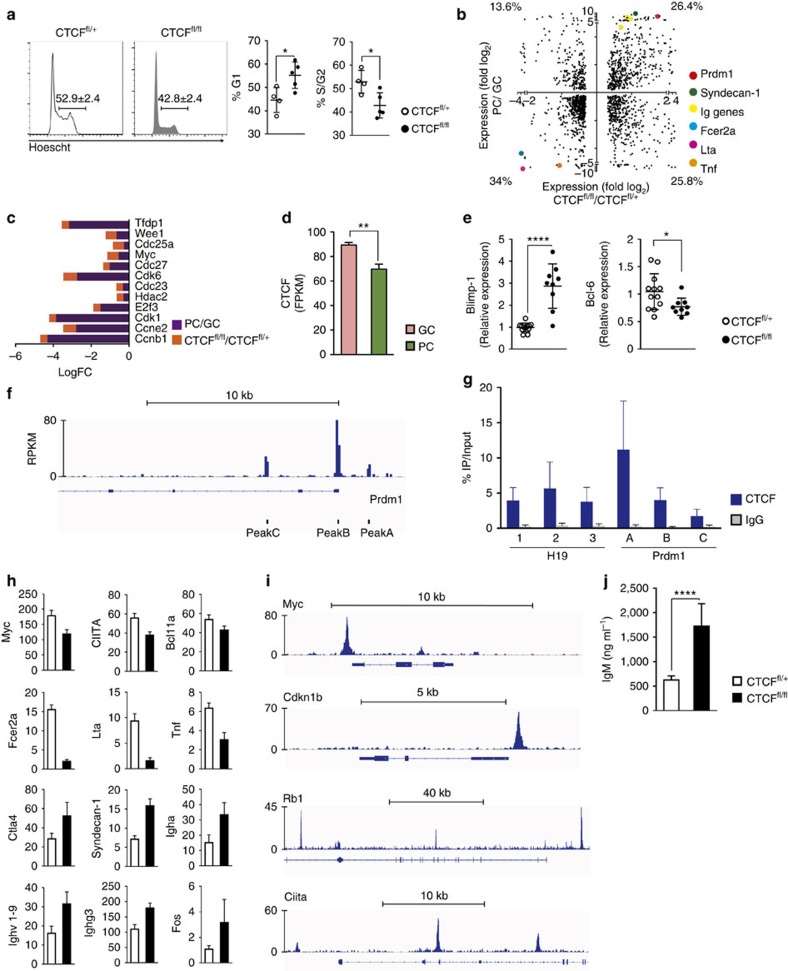
Figure 5. CTCF deficiency recapitulates key features of plasma cells.
(a) FACS cell-cycle analysis of hCD2+ cells from CTCFfl/+ (n=4) and CTCFfl/fl (n=5) mice after 48 h of stimulation with CD3/CD28 and T cells. Numbers indicate percentages ±s.d. Quantification of G1 and S/G2 phase proportions is shown on the right. p(G1)=0.0242; p(S/G2)=0.0221, two-tailed Student’s t-test. (b) Two-dimension expression plot. X axis, log2 fold values of significantly changed genes upon CTCF deficiency (CTCFfl/fl versus CTCFfl/+, CD3/CD28-stimulated B cells). Y axis, log2 fold values of significantly changed genes in PC versus GC B cells (data extracted from ref. 33. Coloured dots highlight genes of the PC differentiation programme. (c) Quantification of significantly changed cell-cycle-related genes. Log fold change (LogFC) in PC versus GC B cells (purple) and in CTCFfl/fl versus CTCFfl/+ CD3/CD28 T-stimulated B cells (orange). (d) RNA-seq analysis of CTCF expression in GC B cells and PC (data extracted from ref. 33). (e) qRT-PCR analysis of Blimp-1 (Prdm1) and Bcl-6 expression in CD3/CD28 T-stimulated CTCFfl/+ (n=12) and CTCFfl/fl (n=9) hCD2+ cells. P(Blimp-1)< 0.0001; P(Bcl-6)=0.0331. (f) CTCF binding at the Prdm1 locus in spleen B cells stimulated with LPS/IL4 (data from ref. 34). (g) CTCF ChIP-qPCR on Peaks A–C of the Prdm1 (Blimp-1) locus in spleen B cells stimulated with CD3/CD28 and T cells for 48 h (n=3). Data show per cent of input. IgG ChIP is shown as negative control. H19 Peaks 1–3 are shown as positive control for CTCF ChIP. Error bars indicate s.d. (h) RNA-seq analysis of Blimp-1 (Prmd1) targets in hCD2+ cells from CTCFfl/+ (n=3) and CTCFfl/fl (n=3) mice stimulated with CD3/CD28 and T cells for 48 h. (i) Blimp-1 binding at Myc, Cdkn1b, Rb1 and Ciita locus in plasmablasts (data from ref. 9) (j) ELISA quantification of IgM secretion from CD3/CD28 T-stimulated CTCFfl/+ (n=3) and CTCFfl/fl (n=3) cells for 72 h (P=0.0151). (CTCFfl/+, white; CTCFfl/fl; black). Statistical analysis was done with two-tailed unpaired Student’s t-test.

