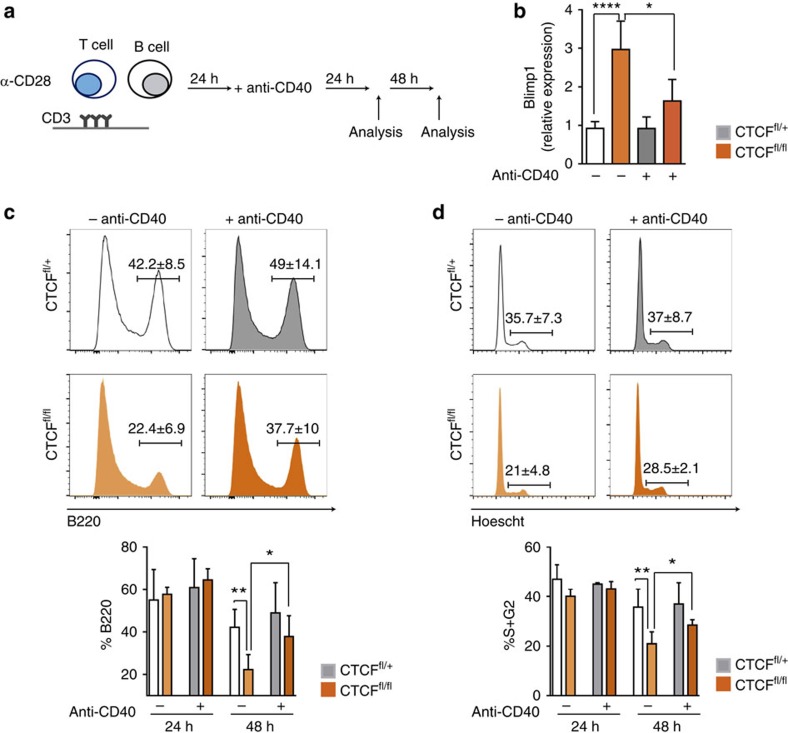
Figure 6. CD40 signalling rescues Blimp-1 expression levels and cell proliferation in CTCF-deficient cells.
CTCFfl/+ (n=4) and CTCFfl/fl (n=5) splenic B cells stimulated with CD3/CD28 T cells were treated with anti-CD40 antibody (+anti-CD40), and compared to cells left untreated (−anti-CD40). (a) Representation of the experimental approach. (b) Analysis of Blimp-1 (Prdm1) mRNA by qRT-PCR in hCD2+ CTCFfl/+ or CTCFfl/fl cells after 48 h without or with anti-CD40 treatment. ***P=0.0001, *P=0.0159. (c) Histograms show the percentage of B220+ B cells in CTCFfl/+ and CTCFfl/fl B-T CD3/CD28 co-cultures after 48 h of anti-CD40 treatment. Lower bar graph shows quantification of B220 proportion at 24 and 48 h after CD40 treatment. **P=0.0063, *P=0.023. (d) Histograms show the percentage of cycling (S+G2/M) cells in CTCFfl/+ and CTCFfl/fl B–T CD3/CD28 co-cultures after 48 h of anti-CD40 treatment. Lower bar graph shows quantification of cycling cells at 24 and 48 h after CD40 treatment. **P=0.0083, *P=0.0126. Mean values±s.d. are shown. Statistical analysis was done with two-tailed unpaired Student’s t-test.

