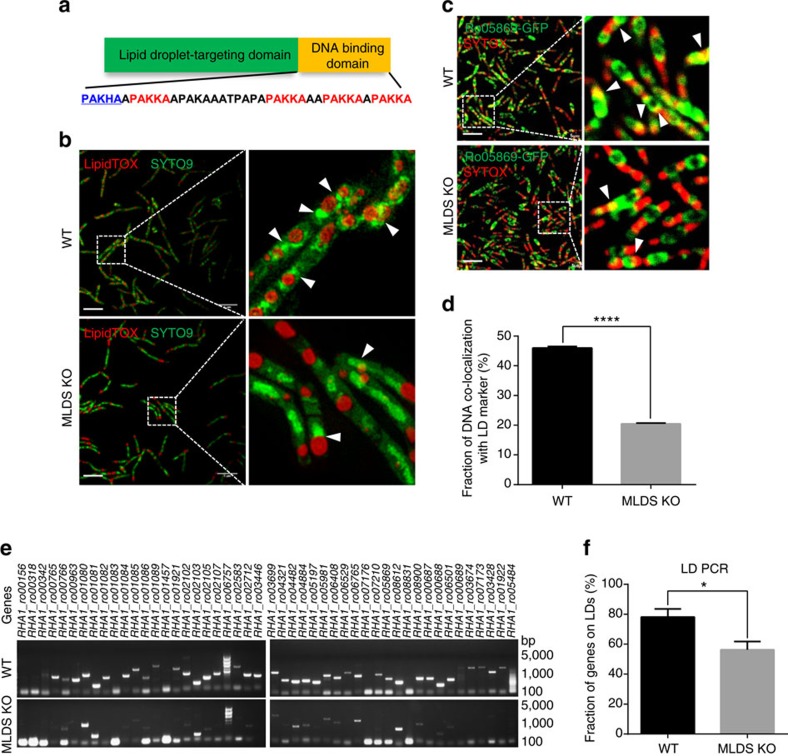
Figure 1. Lipid droplets bind genomic DNA via MLDS in RHA1 cells.
(a) Diagrams of MLDS domains and its C-terminal amino acid sequence. LD-targeting and putative DNA-binding domains and PAKKA motifs were indicated in green, orange, and red, respectively. (b) SIM images of wild type (WT) and MLDS knockout (MLDS KO) RHA1. LDs and DNA were stained with LipidTOX Red (red) and SYTO9 (green), respectively. Scale bar, 5 μm. The association of genomic DNA with LDs was indicated (white arrows). (c) Confocal microscopy images of WT and MLDS KO cells overexpressed RHA1_ro05869-GFP. The green ‘ring-like’ structure represents RHA1_ro05869-GFP targeting to LDs. DNA was stained by SYTOX (red). Scale bar, 5 μm. The co-localization of genomic DNA with RHA1_ro05869-GFP was indicated (white arrows). (d) Quantification of the fraction of DNA co-localized with RHA1_ro05869-GFP relative to the whole genomic DNA in c. Data represent mean±s.e.m., n=100 images. ****P<0.0001, two-tailed t-test. (e,f) PCR analyses of LDs in RHA1. (e) 48 randomly selected genes were checked by PCR using LD fractions from WT and MLDS KO cells as templates. (f) Quantification of detected genes on LD fractions. Data represent mean±s.e.m., n=4. *P<0.05, two-tailed t-test.

