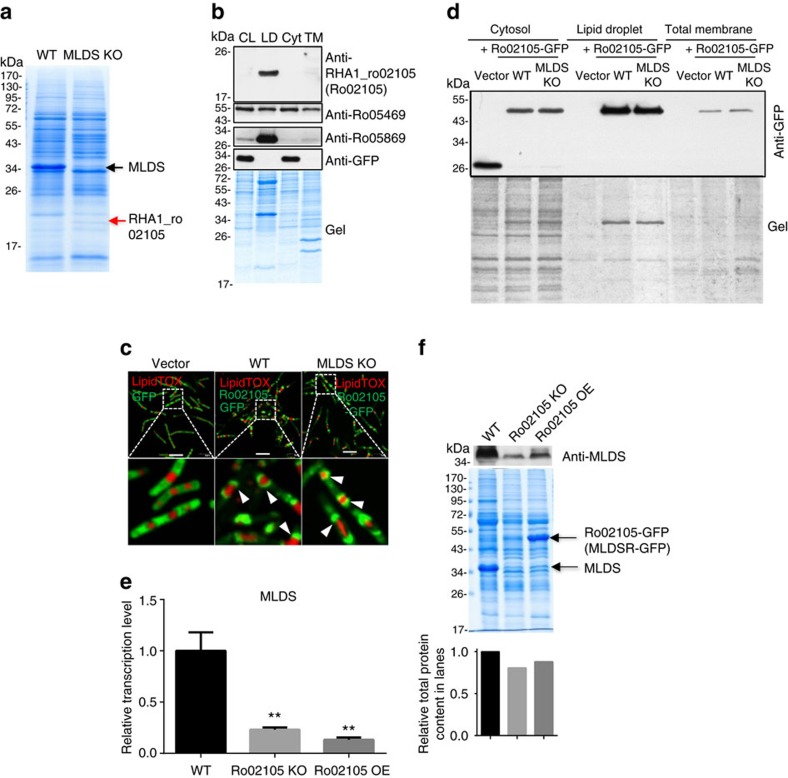
Figure 4. Expression of MLDS is regulated by transcriptional regulator MLDSR.
(a) RHA1_ro02105 was identified on LDs in MLDS KO RHA1 by mass spectrometry (MS) analysis (red arrow). Gel was stained with Colloidal Blue and the band was cut for MS identification. (b) Western blot analysis of cell fractions of RHA1 WT+GFP cells using anti-Ro02105, anti-Ro05469, anti-Ro05869 and anti-GFP. CL, whole cell lysate; LD, lipid droplet; Cyt, cytosol; TM, total membrane. Gel was stained with Colloidal Blue. (c) Confocal microscopy images of RHA1_ro02105-GFP locating on LDs in WT and MLDS KO cells. The LD targeting of RHA1-ro02105-GFP was indicated (white arrows). LDs were stained with LipidTOX Red (red). Scale bar, 5 μm. (d) RHA1_ro02105-GFP located on LDs in WT and MLDS KO cells by western blot analysis of cell fractions of vector, WT and MLDS KO cells. Gel was stained with Colloidal Blue. (e) The transcriptional level of MLDS in RHA1_ro02105 KO and OE cells was measured. Data represent mean±s.e.m., n=3. **P<0.01, two-way ANOVA. (f) The protein level of MLDS in RHA1_ro02105 KO and OE cells was measured. The arrows indicate MLDS and MLDSR-GFP. The bar graph at bottom represents the relative total protein content in the lanes through quantification using Image J software.

