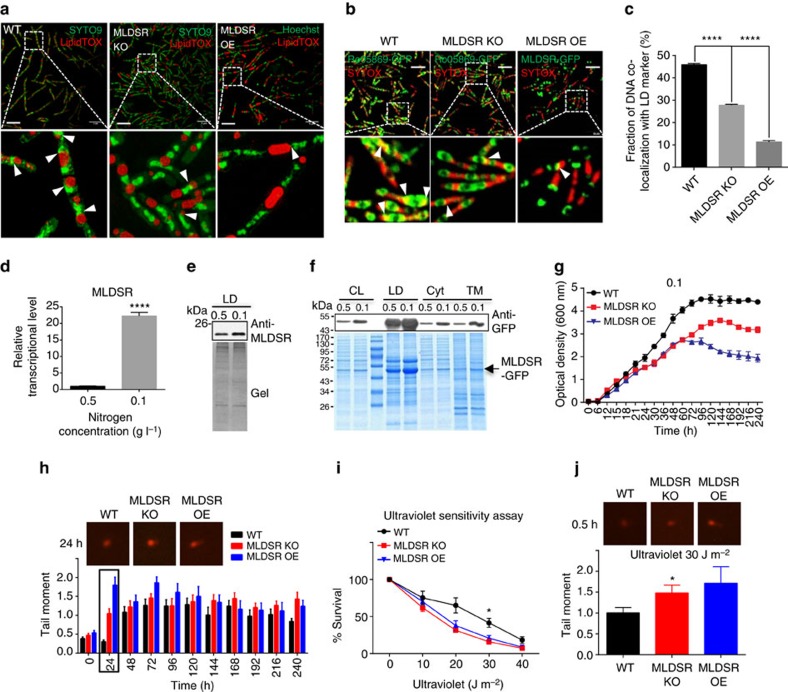
Figure 7. MLDSR affects RHA1 survival by regulating MLDS expression.
(a) The SIM images of DNA (green) locating on LDs (red) in WT and MLDSR KO, MLDSR OE strains. Scale bar, 5 μm. The association of genomic DNA with LDs was indicated (white arrows). (b) The confocal microscopy images of DNA (red) co-localization with LD marker protein in three strains. Scale bar, 5 μm. The co-localization of genomic DNA with RHA1_ro05869-GFP was indicated (white arrows). (c) Quantification of the fraction of DNA co-localized with RHA1_ro05869-GFP relative to the whole genomic DNA in b. Data represent mean±s.e.m., n=100 images. ****P<0.0001, two-way ANOVA. (d,e) The transcriptional (d) and protein (e) levels of MLDSR in RHA1 cultured in different mediums were measured. Data represent mean±s.e.m., n=3. ****P<0.0001, two-tailed t-test. (f) The distribution of MLDSR-GFP in RHA1 cultivated in different mediums was measured. The arrow indicates MLDSR-GFP. (g) The growth curve of WT, MLDSR KO and MLDSR OE strains in MSM with 0.1 g l−1 NH4Cl. Data represent mean±s.d., n=3. (h) Neutral bacterial comet assays for WT, MLDSR KO and MLDSR OE cells cultivated in extremely low nitrogen conditions every 24 h. The comet assay images and quantification of tail moment were shown at top and bottom respectively. Data represent mean±s.e.m., n=50 cells. (i) Ultraviolet sensitivity assay. WT, MLDSR KO and MLDSR OE strains were treated with ultraviolet exposure (0, 10, 20, 30 and 40 J m−2). Data represent mean±s.e.m., n=3. *P<0.05, two-way ANOVA. (j) Neutral bacterial comet assays were performed following ultraviolet treatment (30 J m−2) on WT, MLDSR KO and MLDSR OE cells. Top: comet assay images. Bottom: quantification of tail moment. Data represent mean±s.e.m., n=50 cells. *P<0.05, two-way ANOVA.

