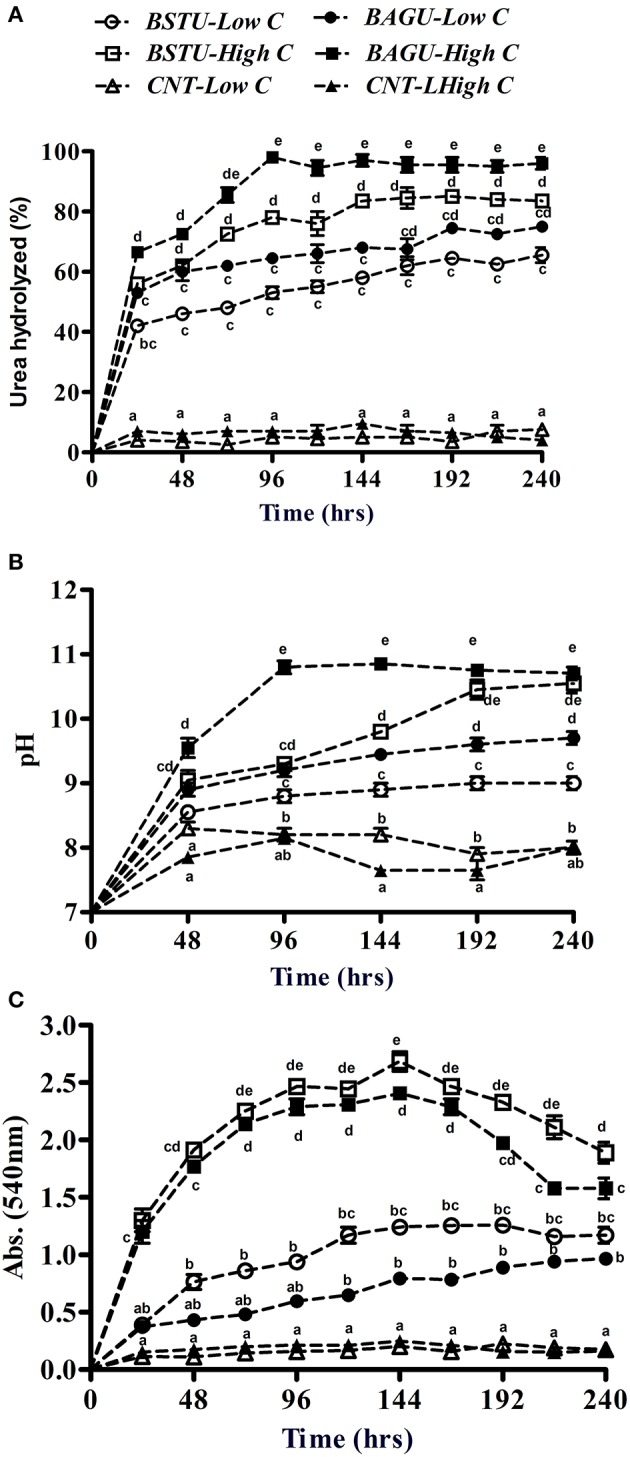
Figure 1.

The effect of nutrient status of Biostimulated and Bioaugmented ureolytic enrichment cultures on the percentage of urea hydrolyzed (A), pH evolution (B), and optical density changes (C). Values are mean ± SD (n = 3). The difference between means sharing a common letter is not statistically significant at P < 0.05.
