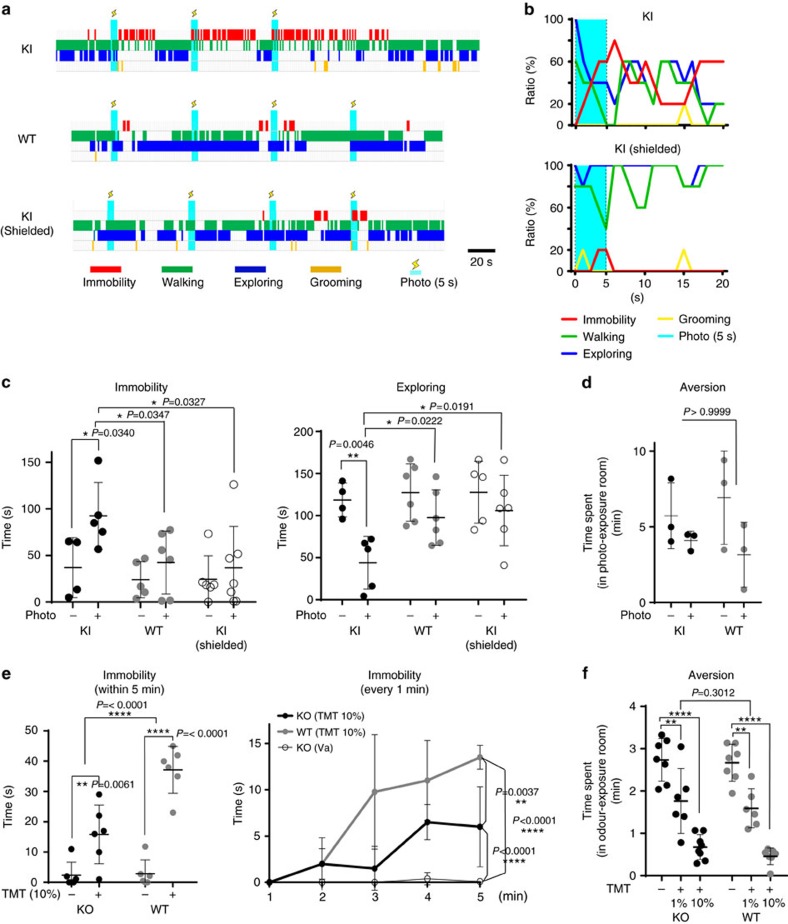
Figure 5. Behavioural analyses of KI and KO mice.
(a) Time-course studies of mouse behaviour after photoillumination. KI, WT and shielded KI mice were analysed. Immobility (red), walking (green), exploring (dark blue) and grooming (yellow) are shown. Timing of the photoillumination (2 Hz of 250 ms pulses at 1.3 mW mm−2 for 5 s) is indicated (cyan bars with lightning marks). (b) Distribution of phototriggered behaviours in the KI and shielded KI mice. Photoillumination of 2 Hz was given for 5 s (cyan) with 250 ms pulses. Percentages of individual behaviours are shown; n=5. (c) Quantification of immobility and exploratory behaviours. Immobility (left) and exploratory (right) behaviours were compared within 3 min after illumination among KI, WT and shielded KI mice. Asterisks indicate two-way analysis of variance (ANOVA) followed by Bonferroni correction. *P<0.05, **P<0.01. Error bars are ±s.d., n=5 for KI and n=6 for WT and shielded KI. (d) Open-field aversion analyses. KI and WT mice were photoilluminated when they stayed in one particular room out of two in a cage. Time lengths that each animal spent in the photo-exposure room are compared within 10 min (n=3). P values of two-way ANOVA followed by Bonferroni correction indicated in red. (e) Immobility responses to TMT are compared between Olfr1019-KO and WT mice. Duration of immobility was measured within 5 min (left) (n=6) or every 1 min (right) (n=4) after TMT presentation. Asterisks indicate two-way ANOVA followed by Bonferroni correction. **P<0.01, ****P<0.0001. Error bars are ±s.d. (f) Open-field aversion to TMT. A piece of filter paper immersed with 1 and 10% TMT was placed in one particular room out of two in a cage. The time spent in the odour-exposure room was measured for the WT and KO mice within 5 min. Asterisks indicate two-way ANOVA followed by Bonferroni correction. **P<0.01, ****P<0.0001. Error bars are ±s.d., n=6 (1% TMT) and 8 (10% TMT).

