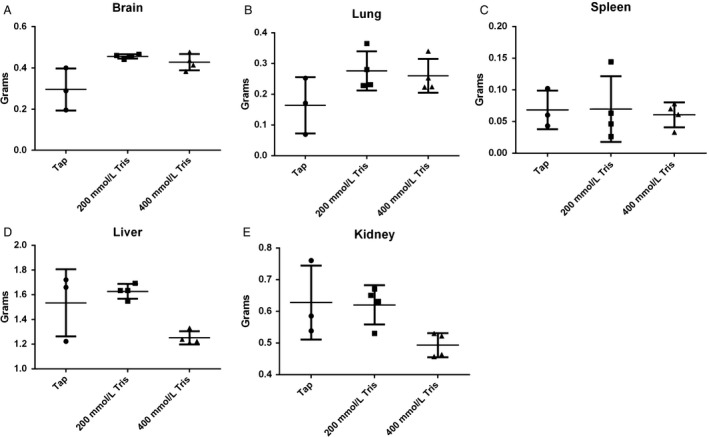
Figure 2.

Comparison of organ weights between the treatments groups. Weights of (A) brain, (B) lung, (C) spleen, (D) liver, (E) kidney of the three groups of treatment, tap, 200 mmol/L, and 400 mmol/L of Tris–base. (n = 3 for tap and n = 4 for treated groups), were measured at necropsy. Nontreated group tend to have smaller brain and lungs and bigger liver and kidney, but the difference was not significant. Mean ± standard error of the mean (SEM) is shown. A two‐tailed Student's t‐test was used to calculate statistical significance.
