
Figure 1.
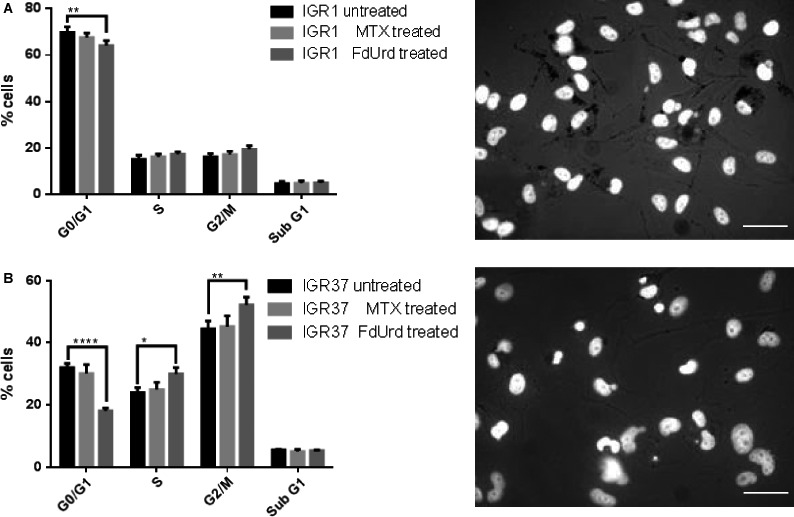
Flow cytometric cell cycle analysis (left) and microscopic phenotype analysis of IGR1 and IGR37 cells (right). Histogram data of BrdU and 7‐AAD stained untreated, MTX (10 μmol/L, 24 h), or FdUrd (10 μmol/L, 24 h) treated IGR1 cells (A) and IGR37 cells (B). Bright‐field microscopy visualizes pigmentation (black grains) of untreated IGR1 and IGR37 cells. DNA was counterstained with Hoechst33342. Scale bar = 50 μm. Data represent means ± SD from three experiments. *P < 0.05 by two‐way ANOVA with Tuckey's multiple comparisons test.