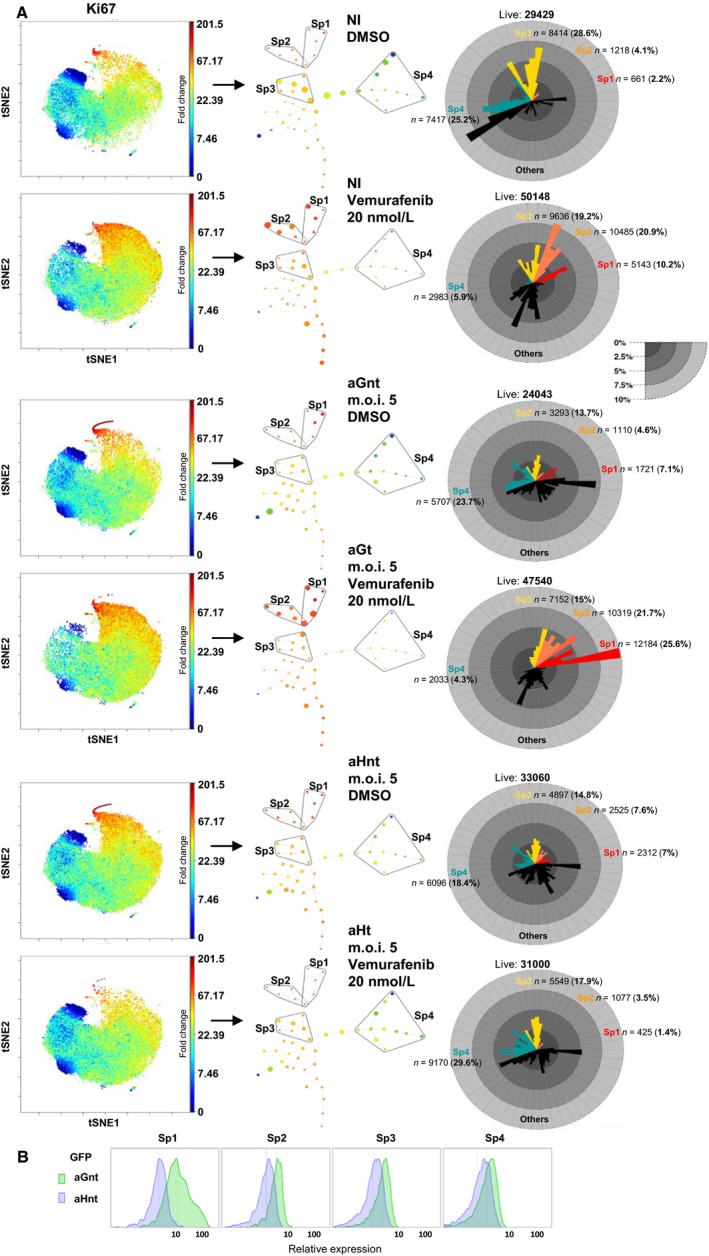
Figure 2.

(A) Mass cytometry analysis of the low‐dose vemurafenib‐induced paradoxical proliferation and its suppression in HuR‐overexpressing A375 cells: viSNE maps for NI excipient‐ (DMSO) and vemurafenib‐treated cells, aG (m.o.i. 5) excipient‐ (aGnt) and vemurafenib‐treated (aGt) cells, aH (m.o.i. 5) excipient‐ (aHnt) and vemurafenib‐treated (aHt) cells, with regard to Ki67 expression show an increase in the size of the high Ki67 cells in NI vemurafenib‐treated and aGt but not aHt cells (red/orange dots in the top‐middle area of the maps). The SPADE spanning tree generated from viSNE maps was used to select four subpopulations (Sp1, Sp2, Sp3, and Sp4): the size of the dots is proportional to the number of cells which is also visible in the adjacent star plots. The color of the dots is an indication of the relative Ki67 expression level (based on the median value for each cluster), from red (high) to dark blue (low). Star plots indicate the size and proportion of each subpopulation (Sp1: red, Sp2: orange, Sp3: yellow, Sp4: blue) and each cluster within them for each spanning tree. Note the overlap zone between Sp1 and Sp2 subpopulations, due to the common included cluster. Initially, we intended to compare excipient‐ and vemurafenib‐treated A375 cells infected at both validated m.o.i. values (Fig. 1D). However, repeatedly following the successive centrifugation steps that are needed to conduct the mass cytometry analysis, a large amount of cells were lost, possibly due to cell fragility in the vemurafenib‐treated aH cells infected at m.o.i. 25 (currently under investigation). This precludes any valid further statistical analysis for these samples. The data shown are therefore those obtained from samples for which the final amount of cells analyzed with mass cytometry were nearly similar (the number of live cells in each subpopulation is indicated above each star plot). (B) GFP marker distribution expression in aGnt and aHnt cells (used as the negative control), shown as an indication of the sensitivity of the mass cytometry analysis.
