Figure 2.

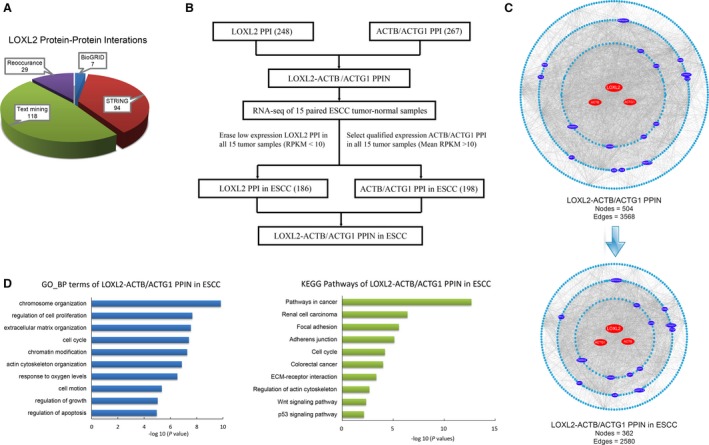
Development and analyses of the LOXL2‐ACTB/ACTG1 protein–protein interaction network in ESCC. (A) Different sources of certain and potential LOXL2 protein–protein interactors. (B) Method for developing the LOXL2‐ACTB/ACTG1 protein–protein interaction network in ESCC. The node numbers in brackets mean gene numbers. PPI, protein–protein interactor; RPKM, reads per kilobase of exon per million mapped reads. (C) PPI subnetwork generation by mapping LOXL2 PPIs and ACTB/ACTG1 PPIs to the BioGRID parental PPI network. LOXL2‐ACTB/ACTG1 PPIN in ESCC (lower panel) was extracted from the total LOXL2‐ACTB/ACTG1 PPIN (upper panel) with the method in (B). Different colors of nodes indicate different types of proteins. Red nodes represent central proteins in the network. Dark blue nodes represent 14 core interacting proteins. Light blue nodes represent common proteins in the network. PPIN, protein–protein interaction network. (D) Significant patterns for biological process (BP) GO terms and KEGG pathways of the LOXL2‐ACTB/ACTG1 PPIN in ESCC.
