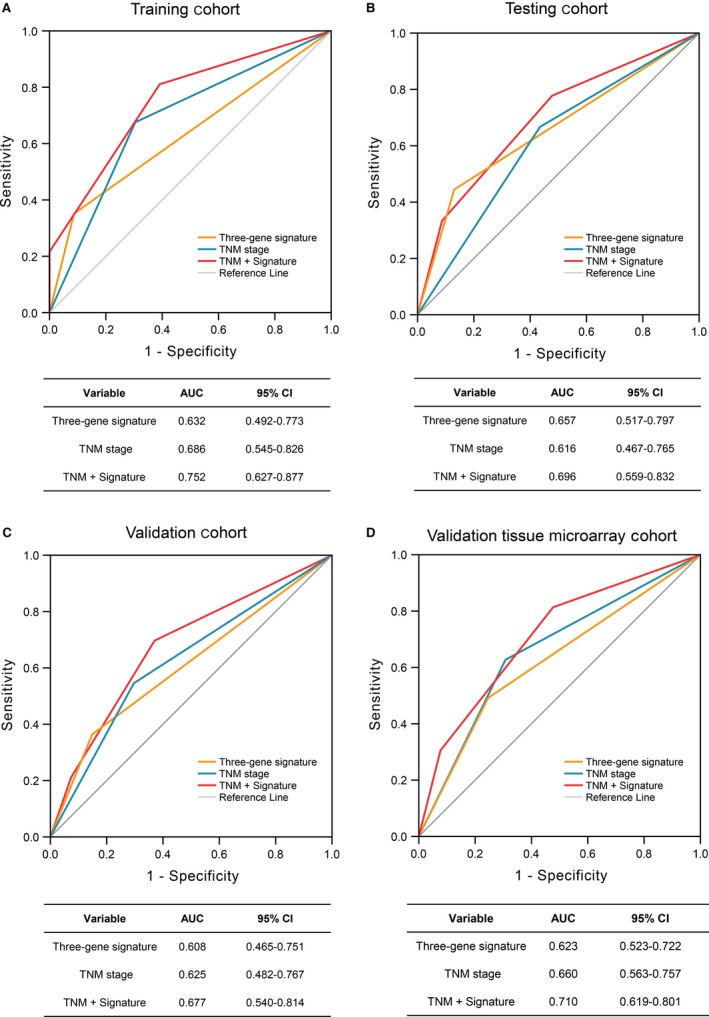
Figure 5.

The predictive ability of the three‐gene signature. The four receiver operating characteristics (ROC) curves in the training cohort (A), the testing cohort (B), the validation cohort (C), and the validation tissue microarray cohort (D). Comparison of sensitivity and specificity for survival prediction by the three‐gene signature, TNM stage, and combination of the two factors. AUC shows the area under the ROC. CI, confidence interval; TNM, pathologic tumor, node, and metastasis.
