Figure 2.

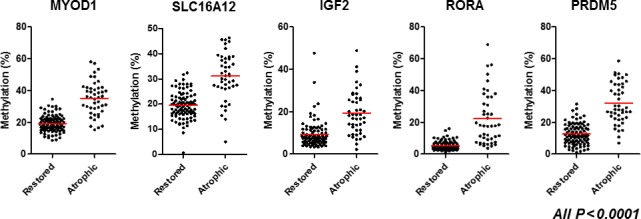
Methylation status of five gene promoters (MYOD1, SLC16A12, IGF2, RORA, and PRDM5) among restored and atrophic types. Horizontal bars represent mean methylation percentage. Statistical analysis was performed using Student's t‐test.

Methylation status of five gene promoters (MYOD1, SLC16A12, IGF2, RORA, and PRDM5) among restored and atrophic types. Horizontal bars represent mean methylation percentage. Statistical analysis was performed using Student's t‐test.